Showing 12 results
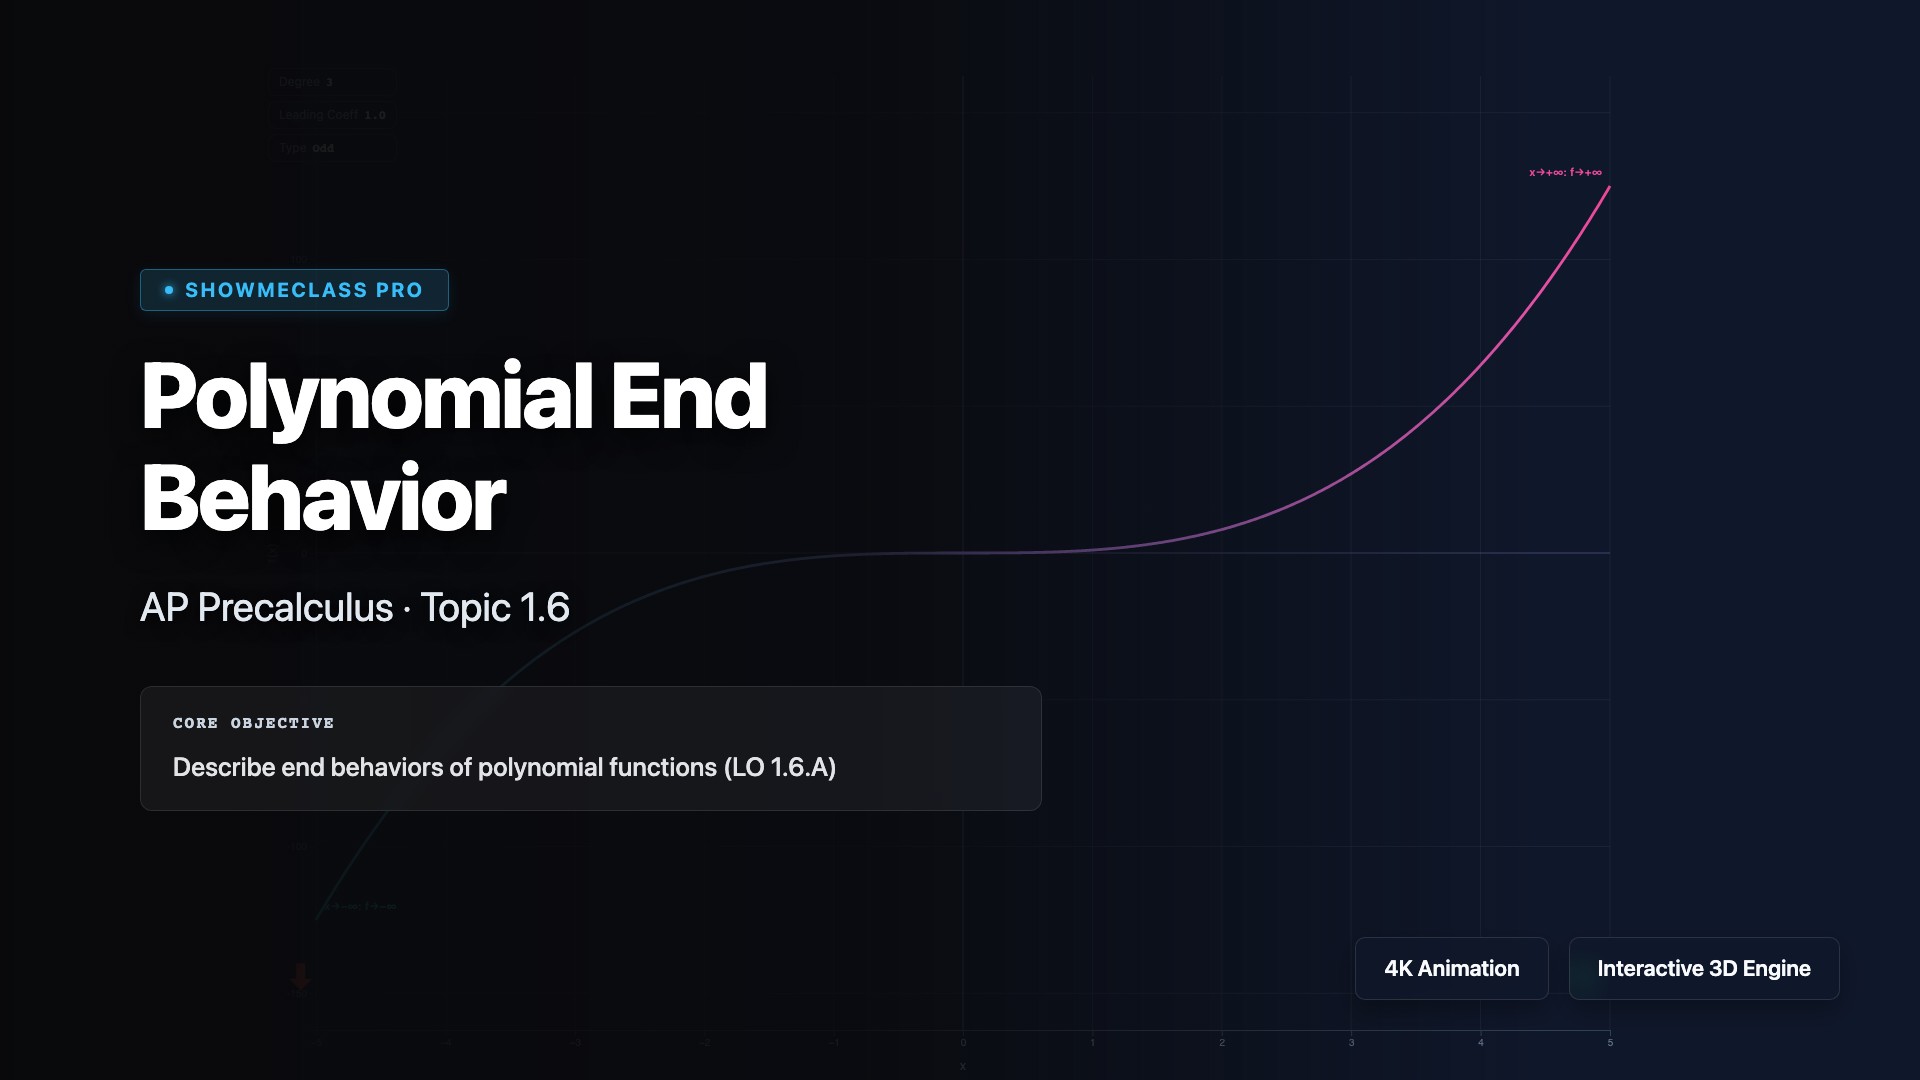
Polynomial End Behavior Analyzer
Visualize how the degree and leading coefficient of a polynomial determine its end behavior. Adjust coefficients interactively and observe limit notation for x→±∞ in real time.
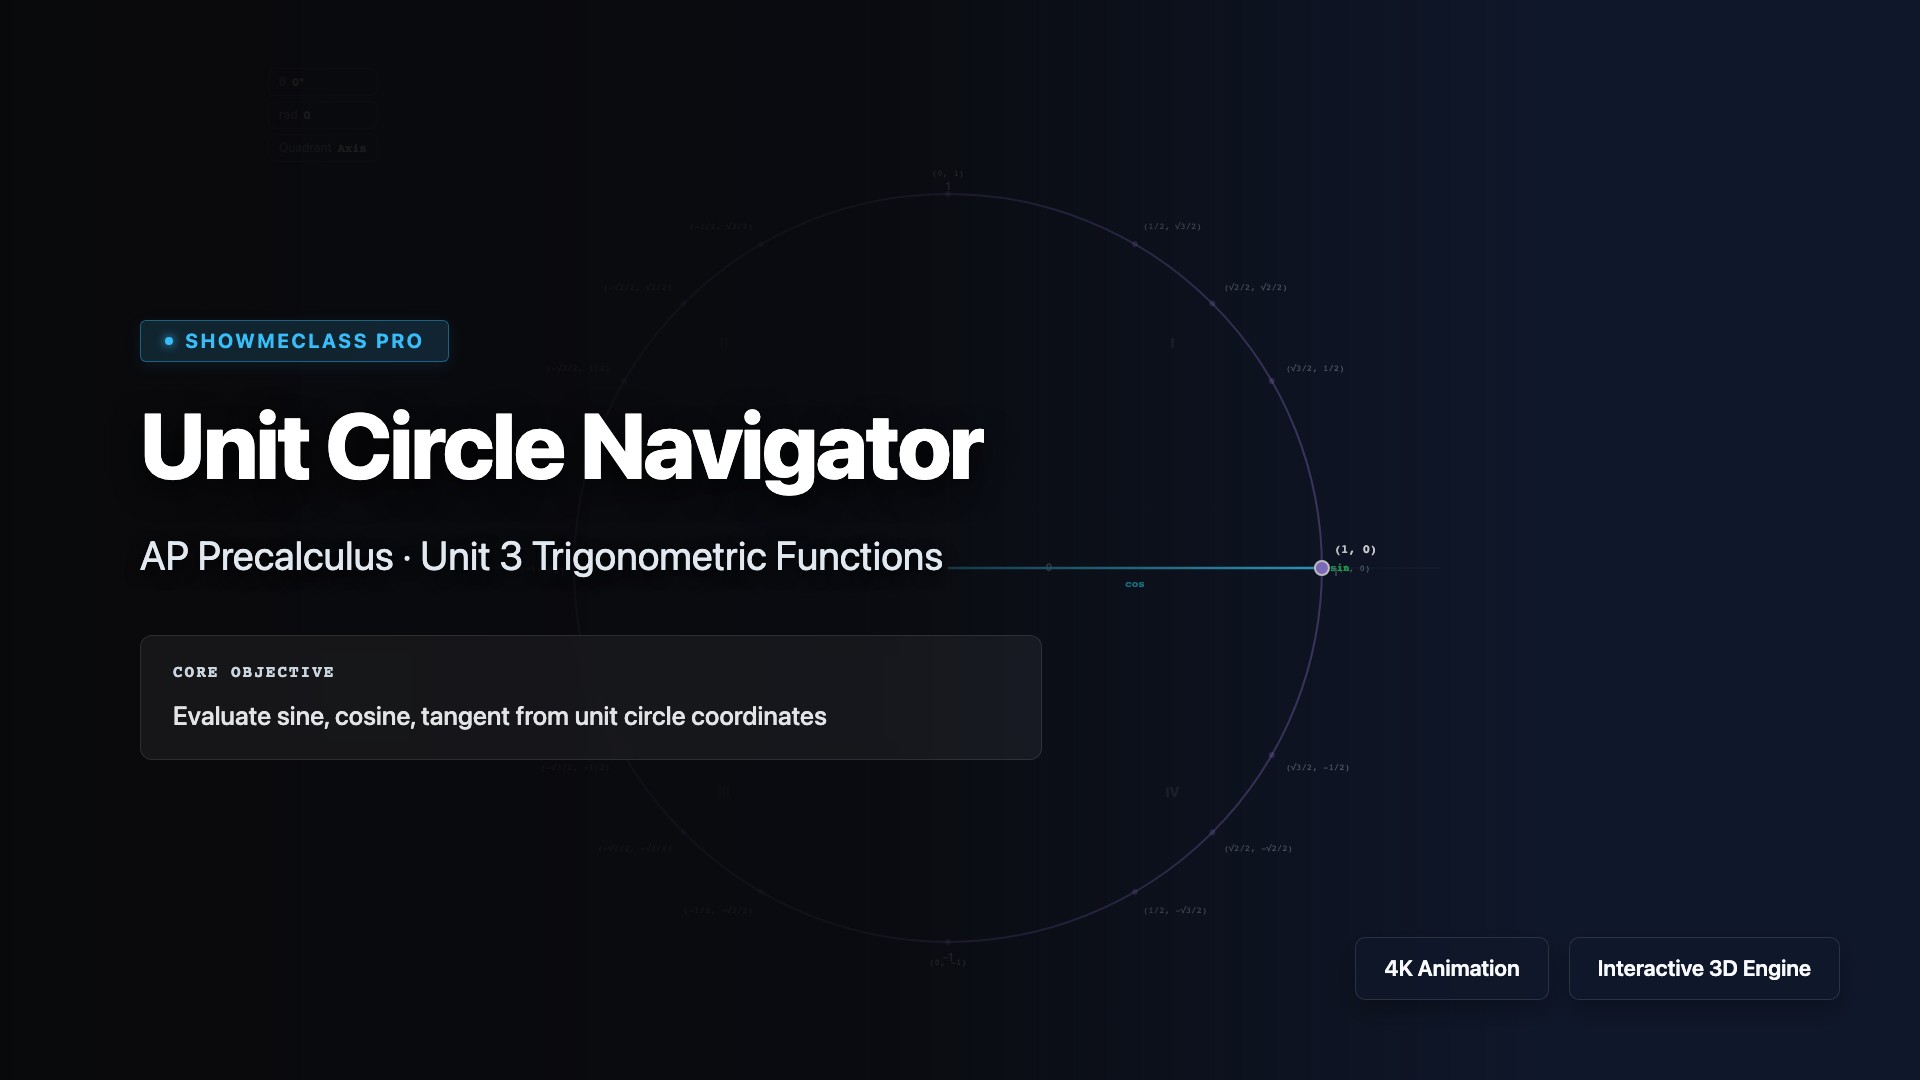
Unit Circle Navigator
Navigate the unit circle interactively. Drag or select angles to see exact sine, cosine, and tangent values. Visualize reference angles, quadrant signs, and the right triangle projection.
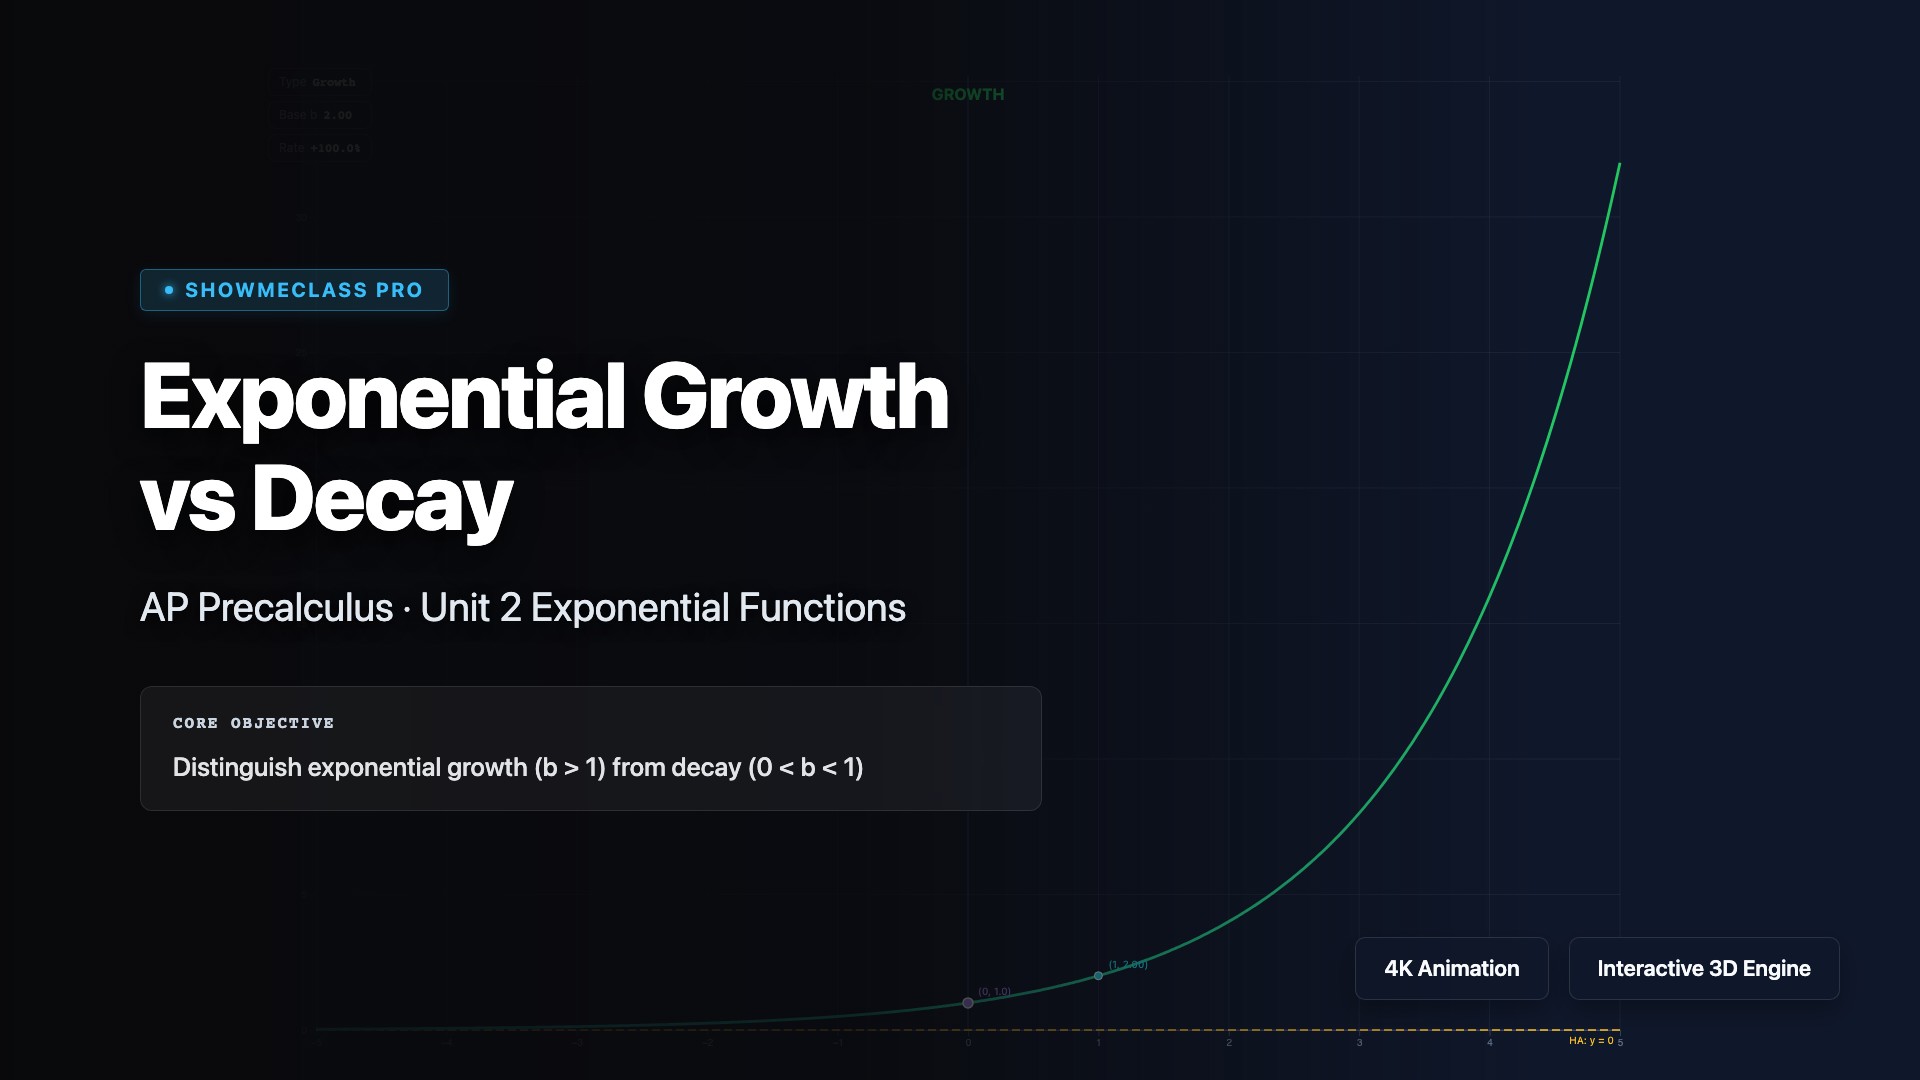
Exponential Growth vs Decay Comparison
Compare exponential growth and decay side by side. Adjust the initial value and base to see how doubling time, half-life, and growth rate change. Includes real-world presets like compound interest and radioactive decay.
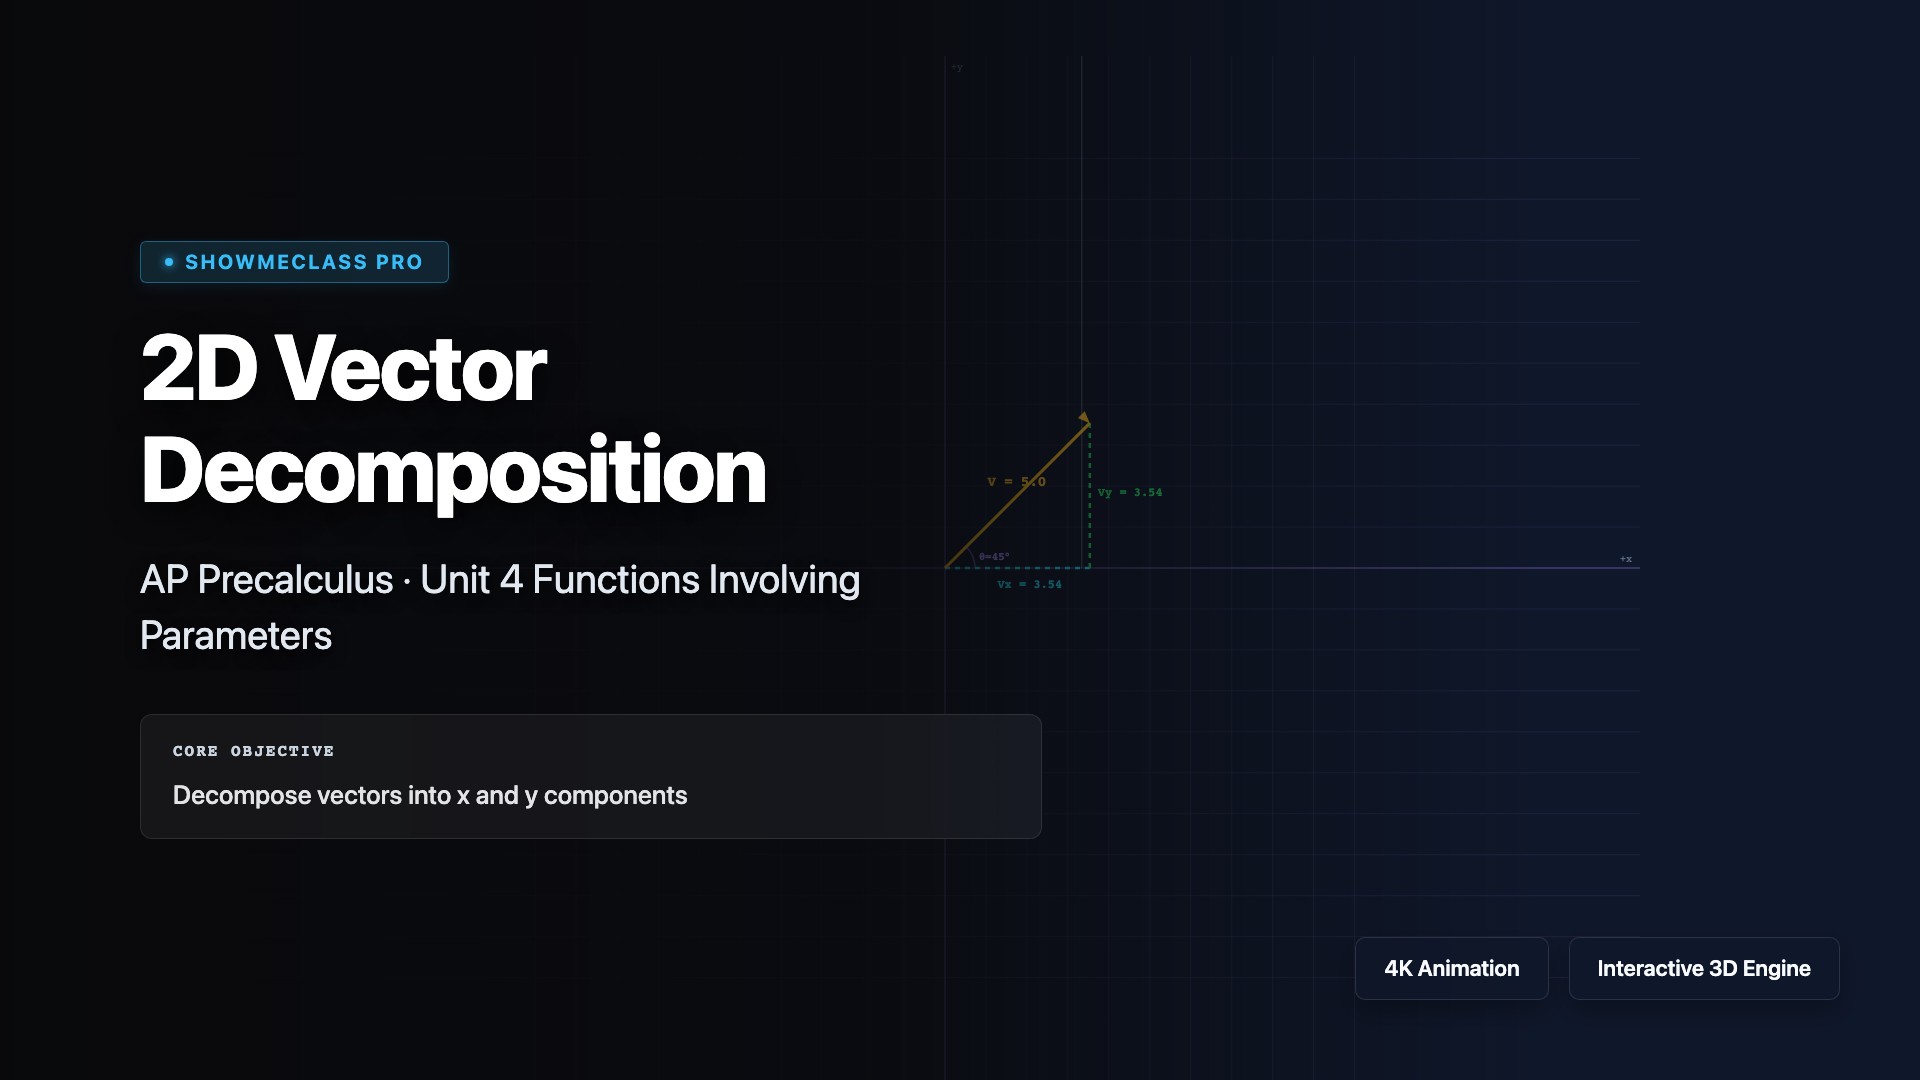
2D Vector Component Decomposition
Interactive vector decomposition: adjust magnitude and angle to see Vx = |V|cos θ and Vy = |V|sin θ components on a grid with right-angle marker.
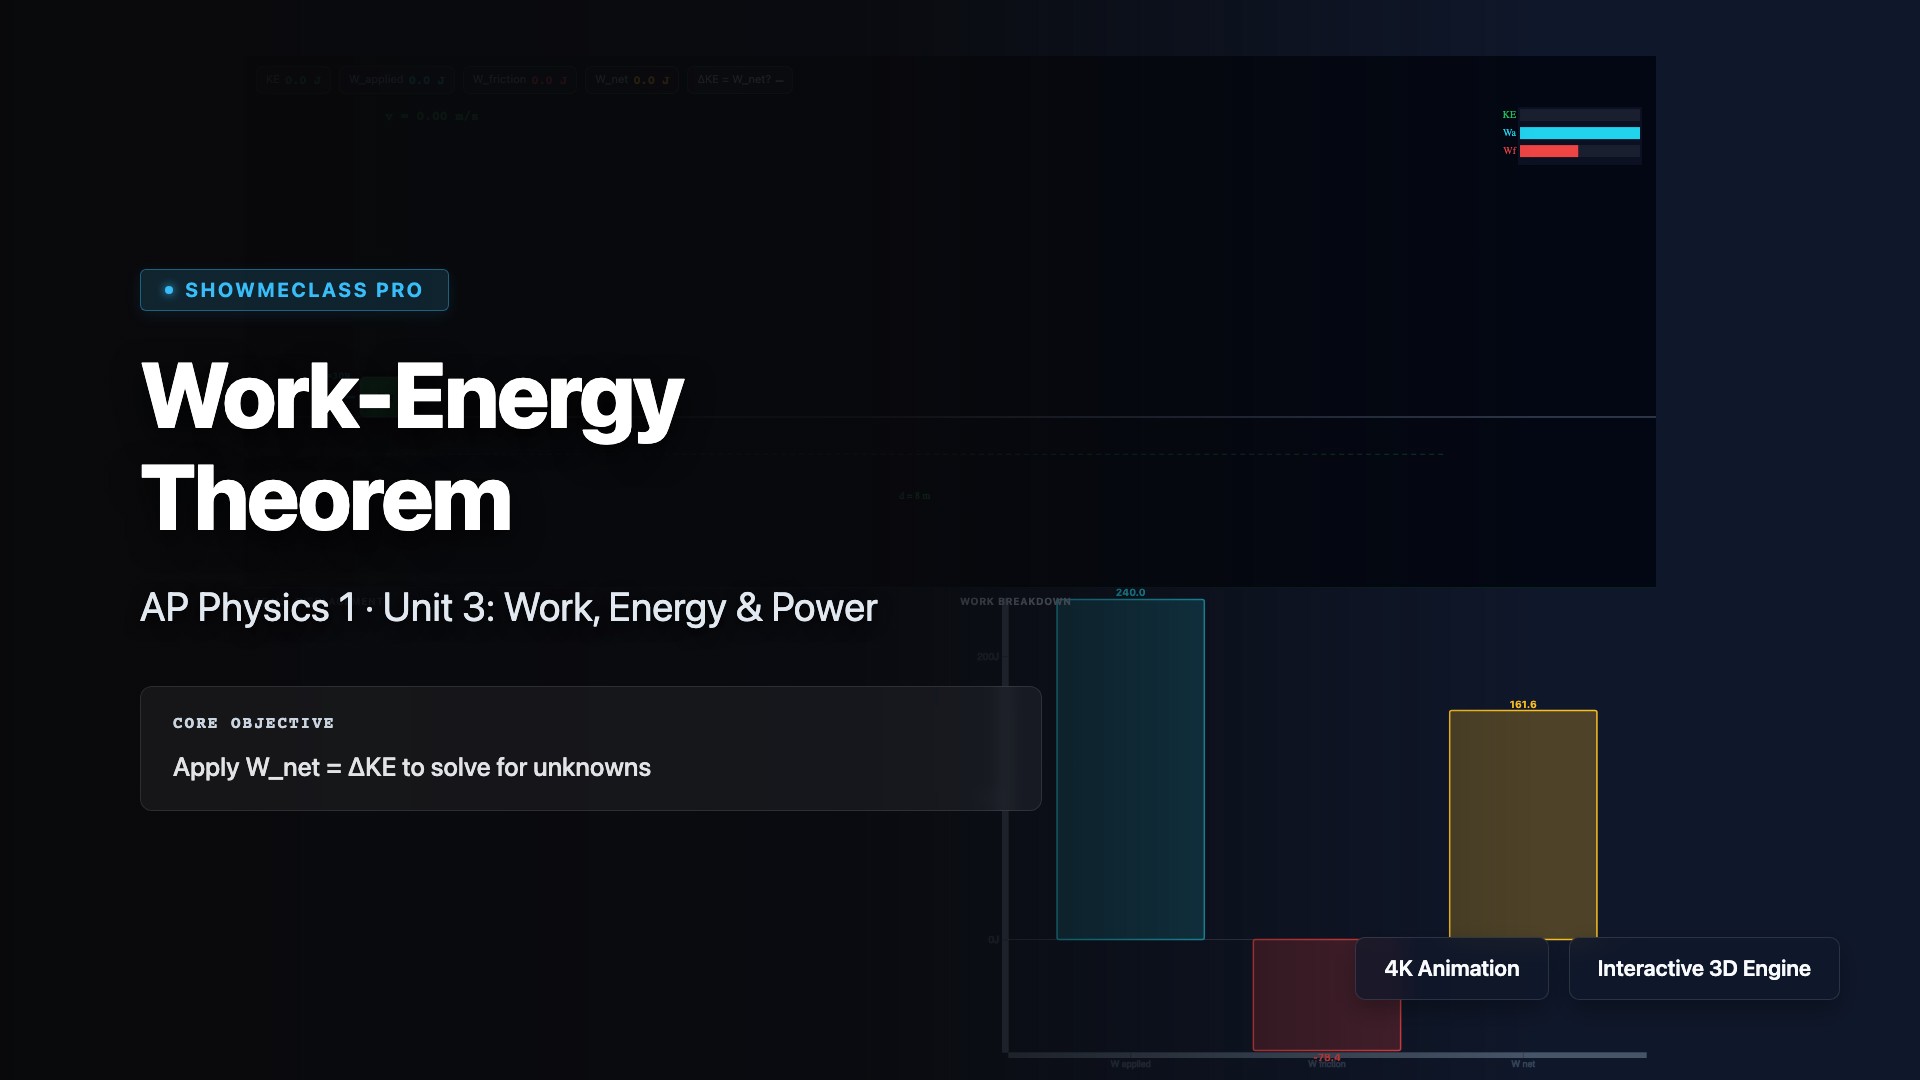
Work-Energy Theorem Lab
Push a block with adjustable force, mass, friction, and angle to verify W_net = ΔKE. Track kinetic energy, work by each force, and total net work with real-time graphs.
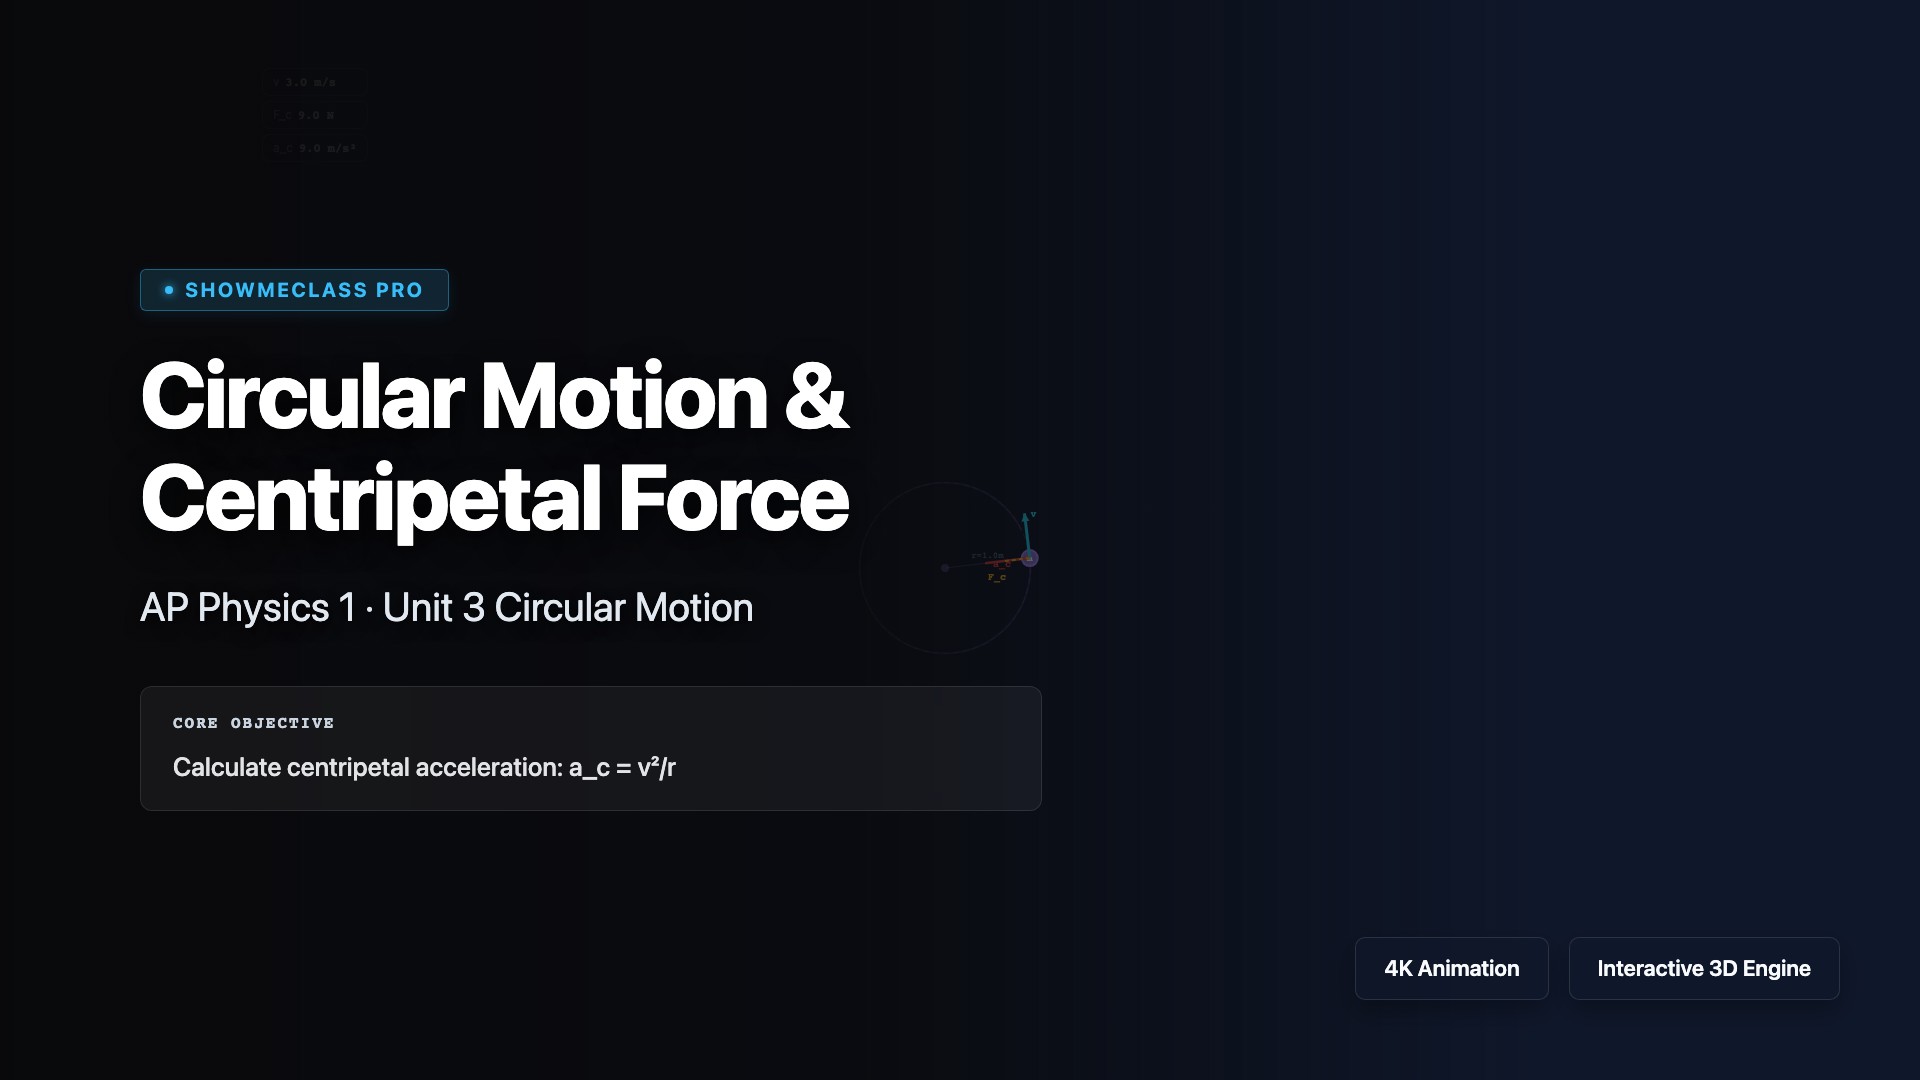
Circular Motion & Centripetal Force
Animate uniform circular motion with real-time velocity, acceleration, and force vectors. Adjust speed, radius, and mass to see how centripetal acceleration a_c = v²/r changes.
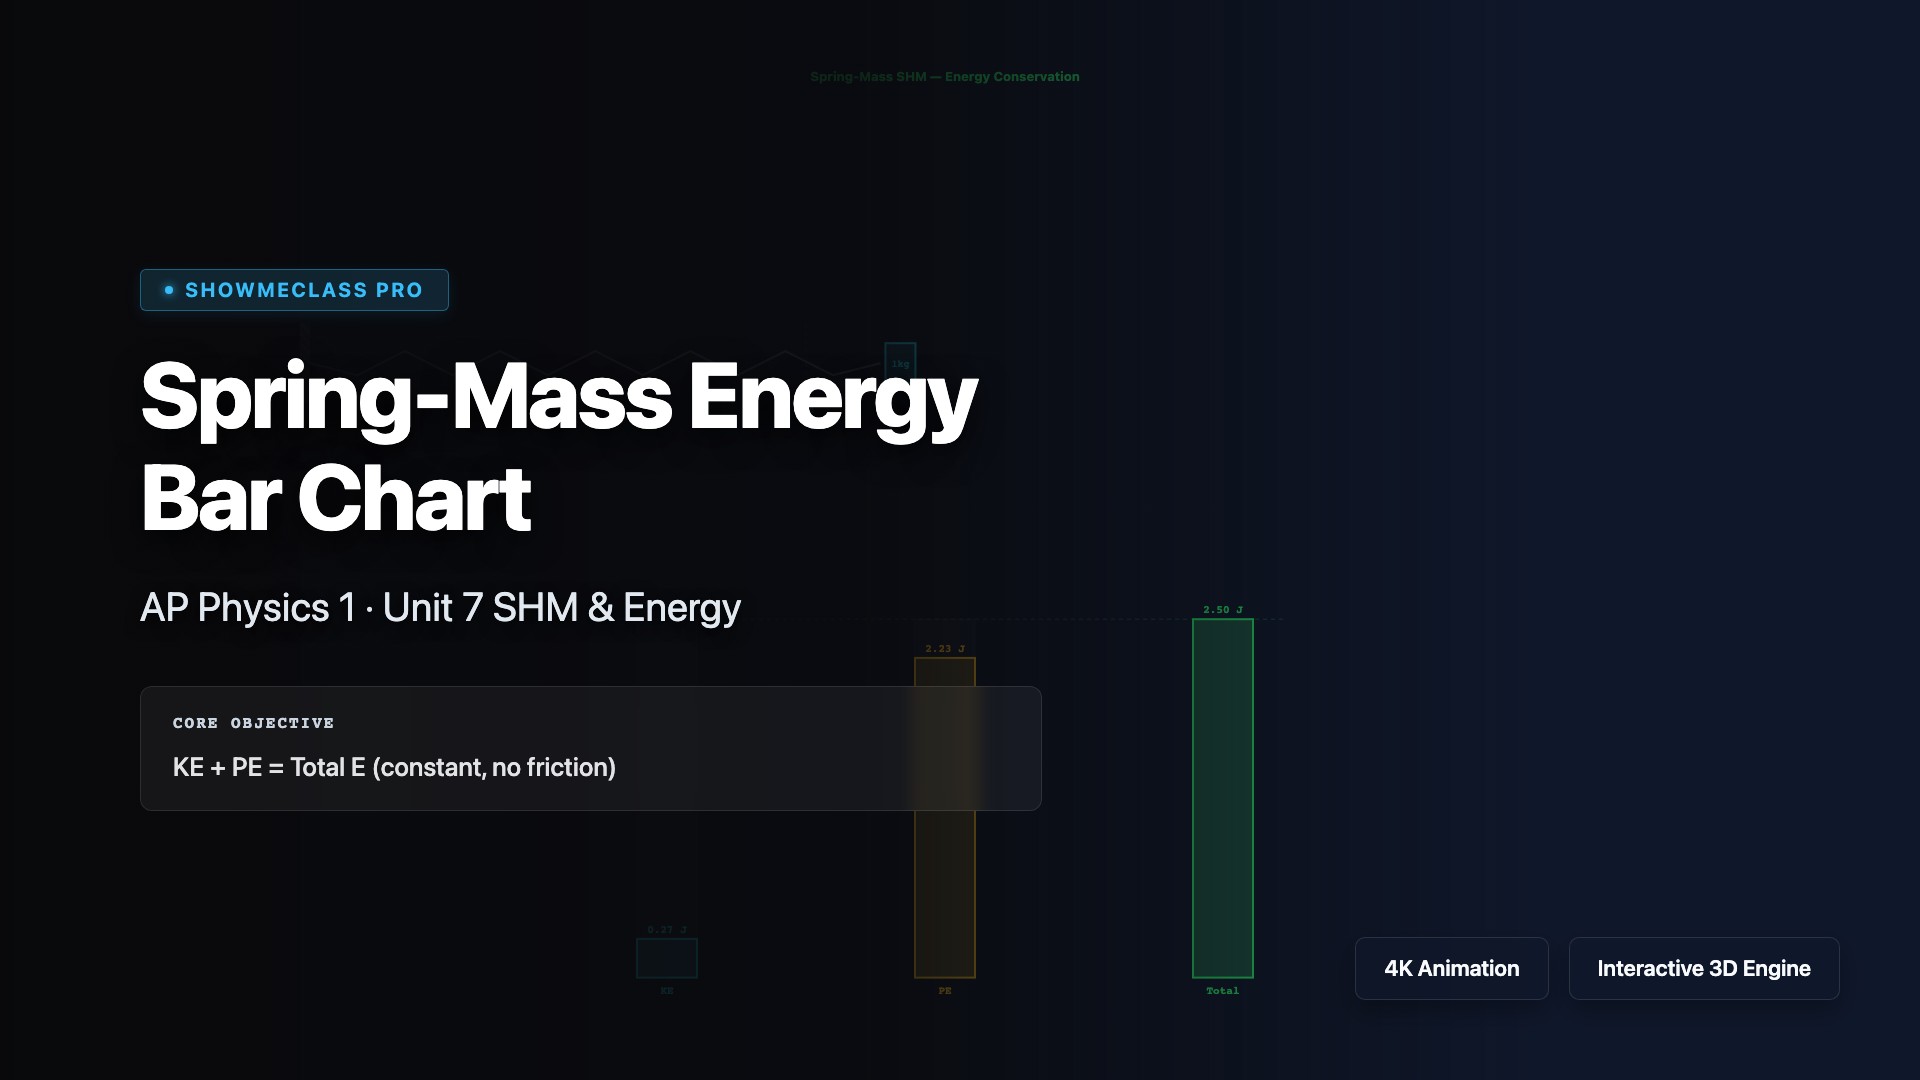
Spring-Mass Energy Bar Chart
Animated spring-mass SHM with real-time KE/PE/Total energy bar chart. PE = ½kx², KE = ½mv². Optional damping shows energy loss.
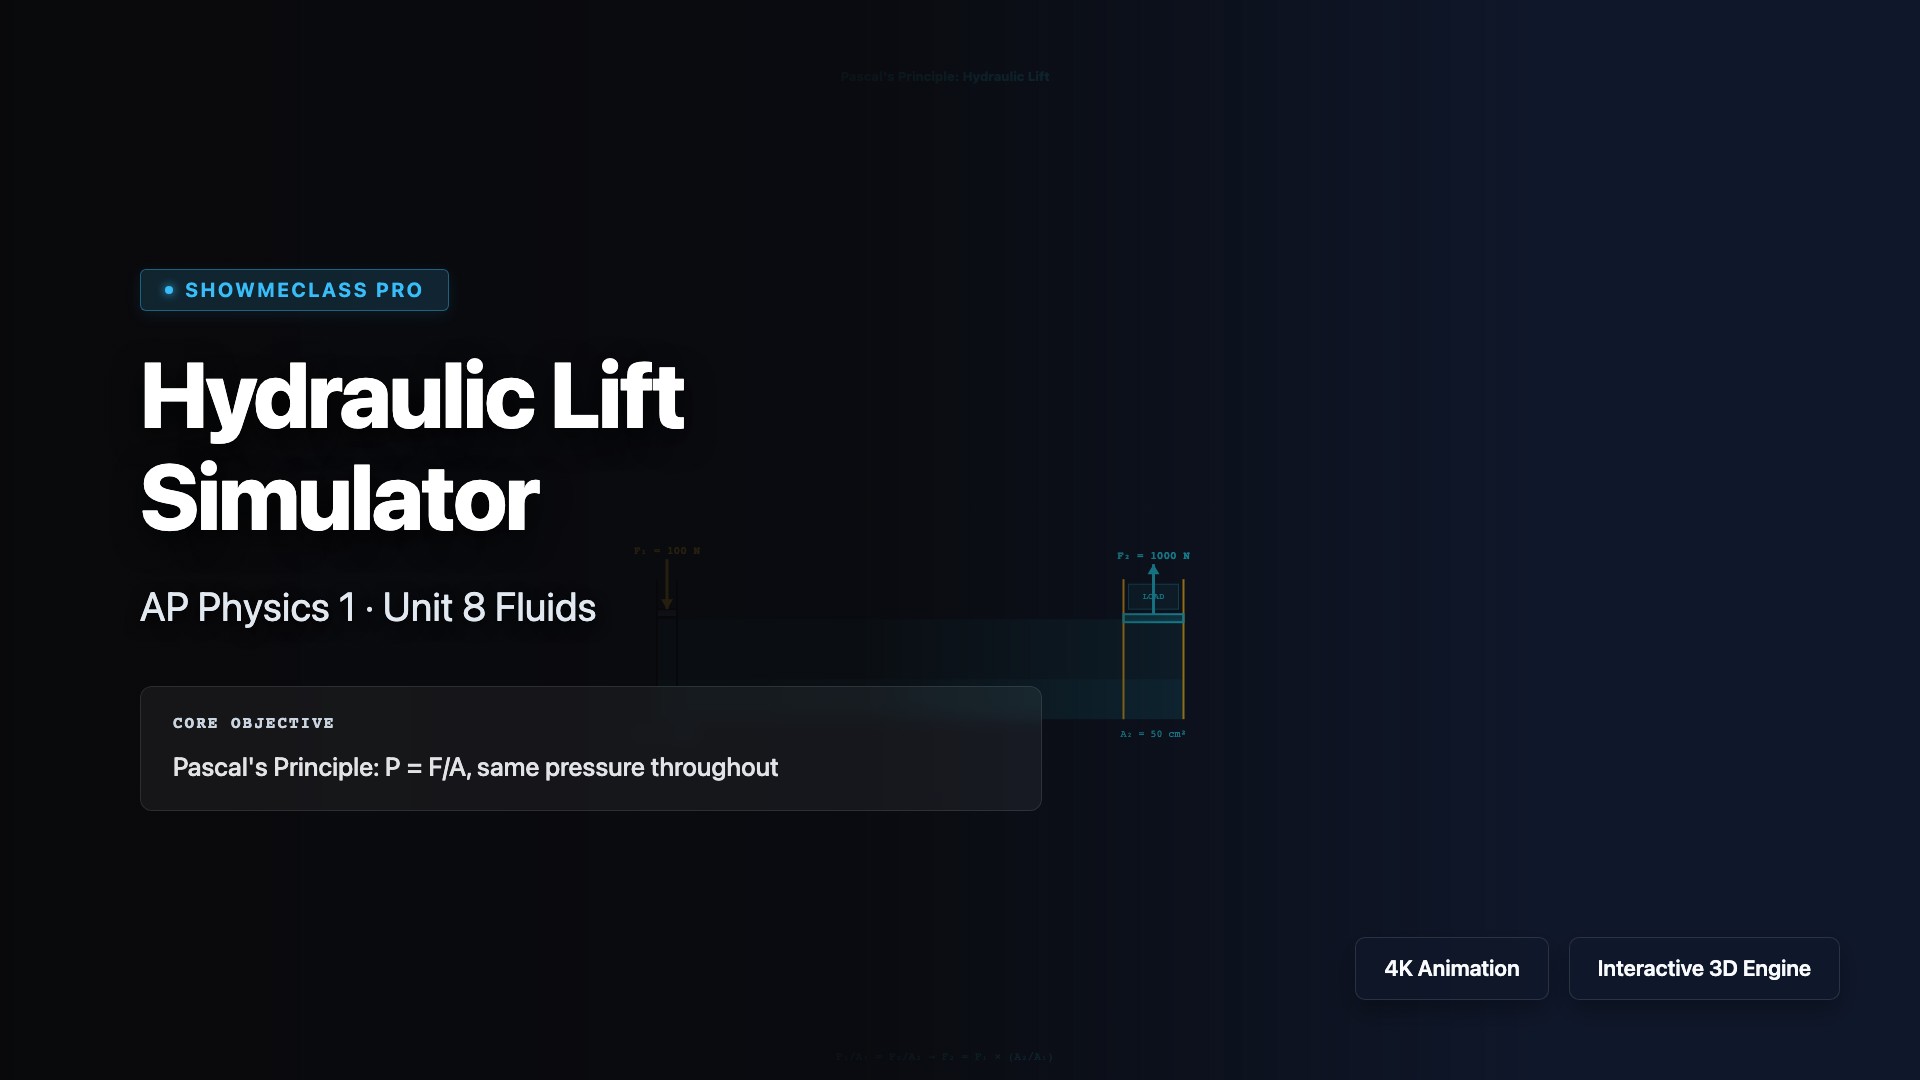
Hydraulic Lift Simulator
Pascal's Principle in action: F₁/A₁ = F₂/A₂. Visualize how a small piston force creates a much larger output force. Shows MA = A₂/A₁.
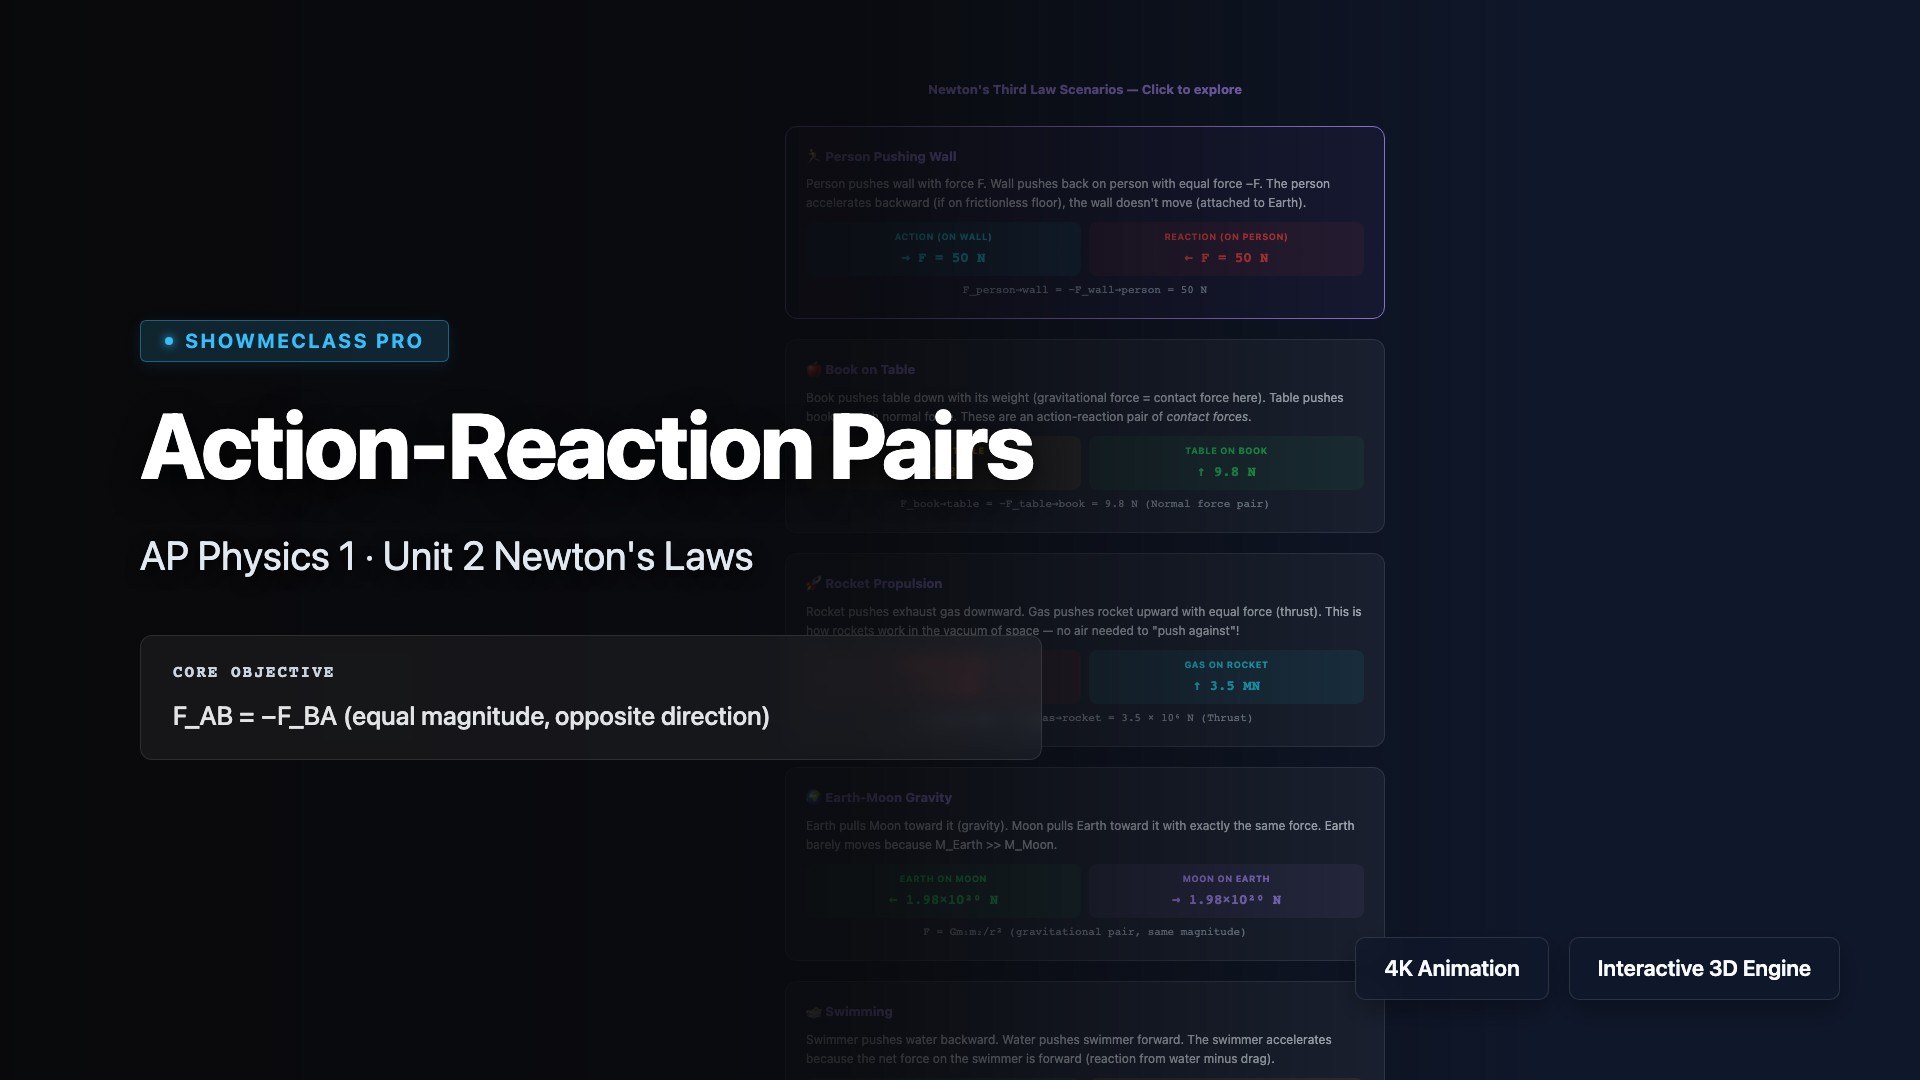
Newton's Third Law Action-Reaction Pairs
Explore 5 scenarios demonstrating F_AB = −F_BA: pushing a wall, book on table, rocket propulsion, Earth-Moon gravity, and swimming. Forces act on different objects.
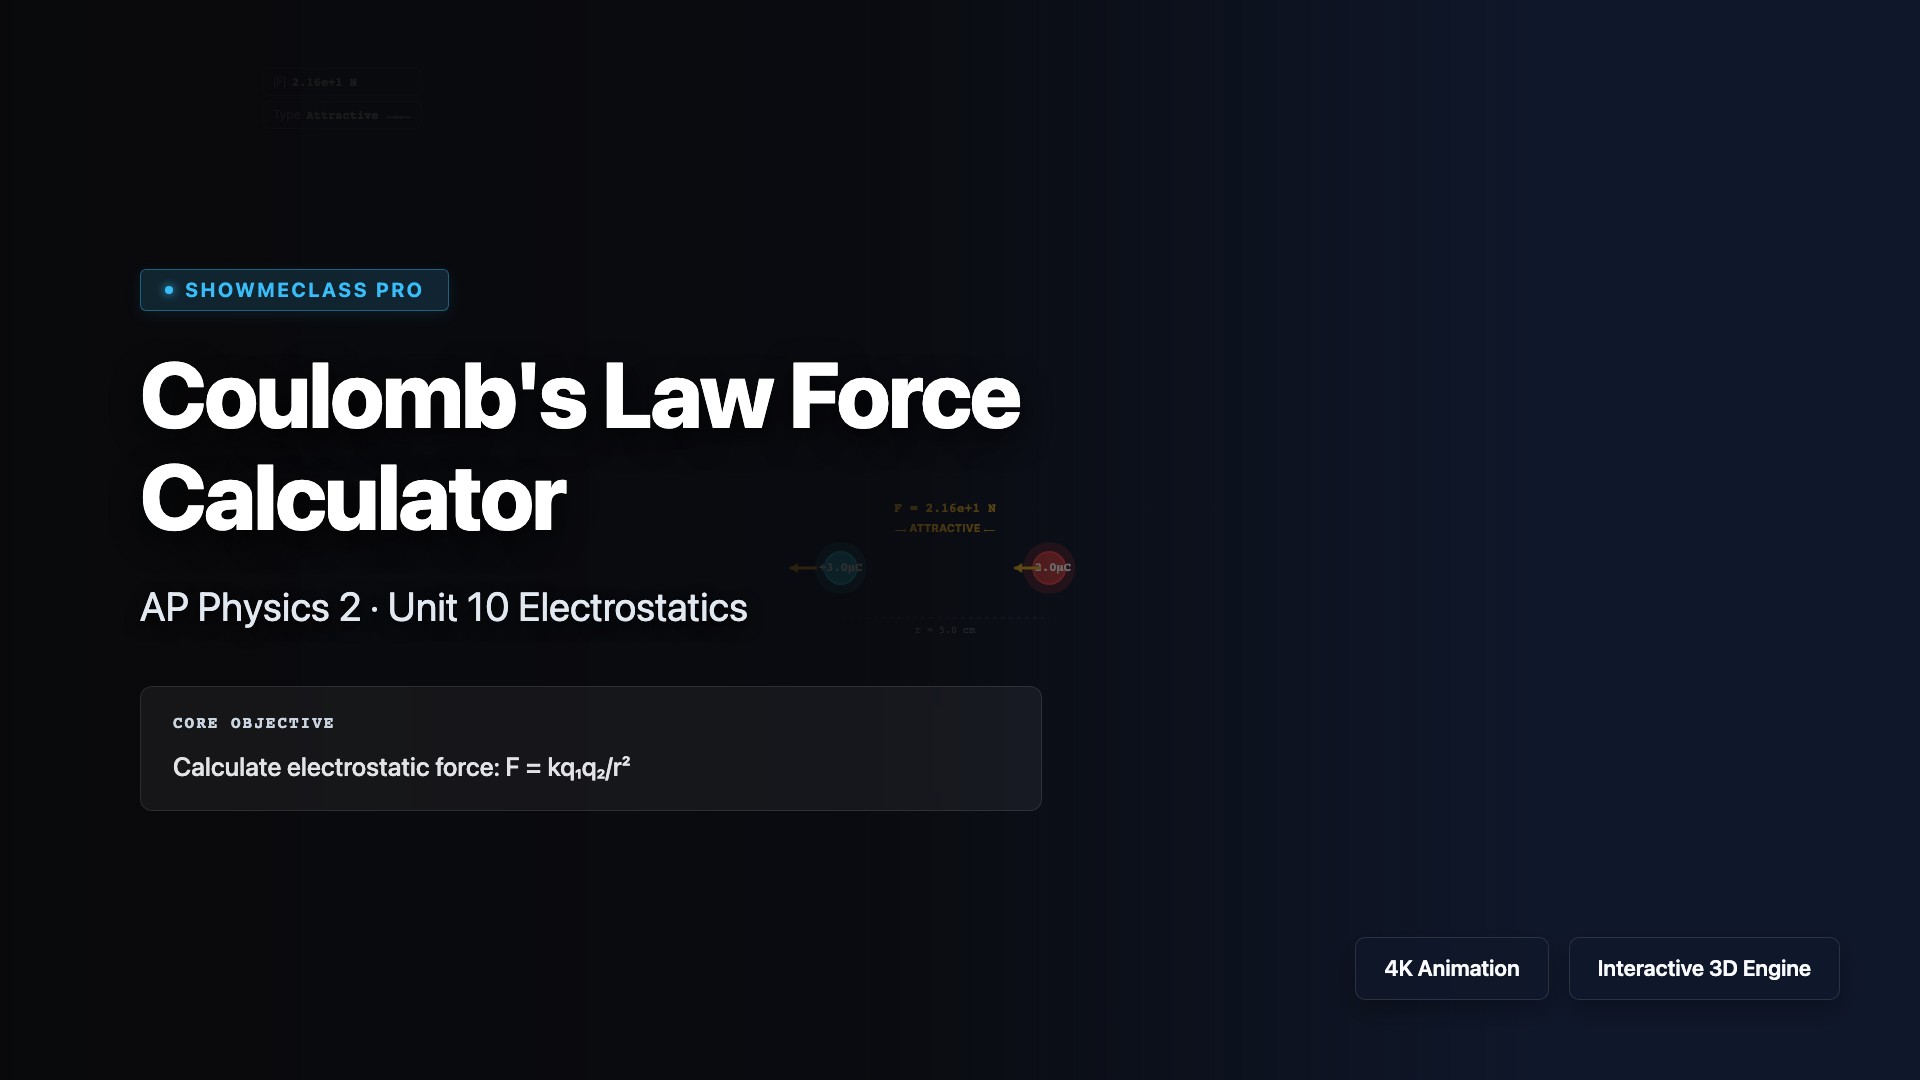
Coulomb's Law Force Calculator
Visualize the electrostatic force between two point charges. Adjust charge magnitude, sign, and distance to see attractive/repulsive forces and the inverse-square F vs r graph.
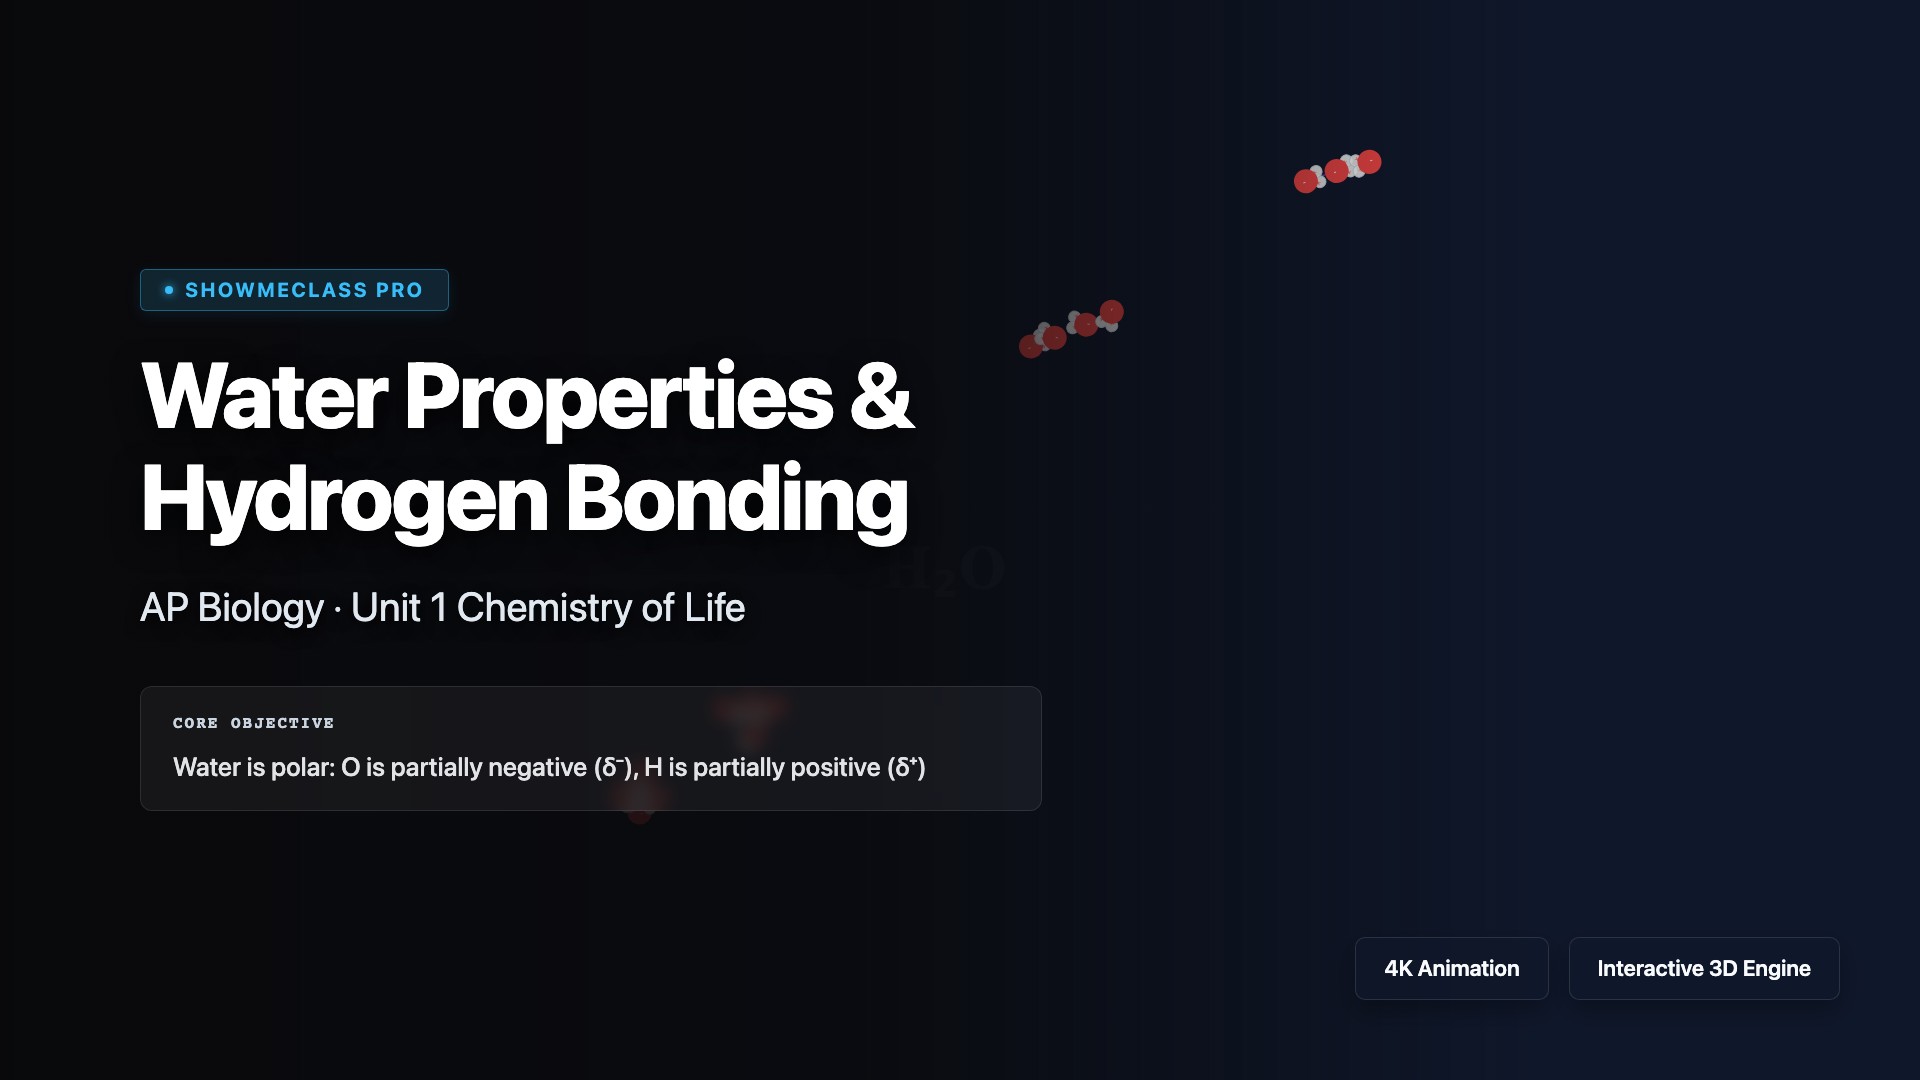
Water Properties & Hydrogen Bonding
Interactive water molecule simulator demonstrating polarity, hydrogen bonding networks, and temperature effects acting as solvent shells around NaCl ions.
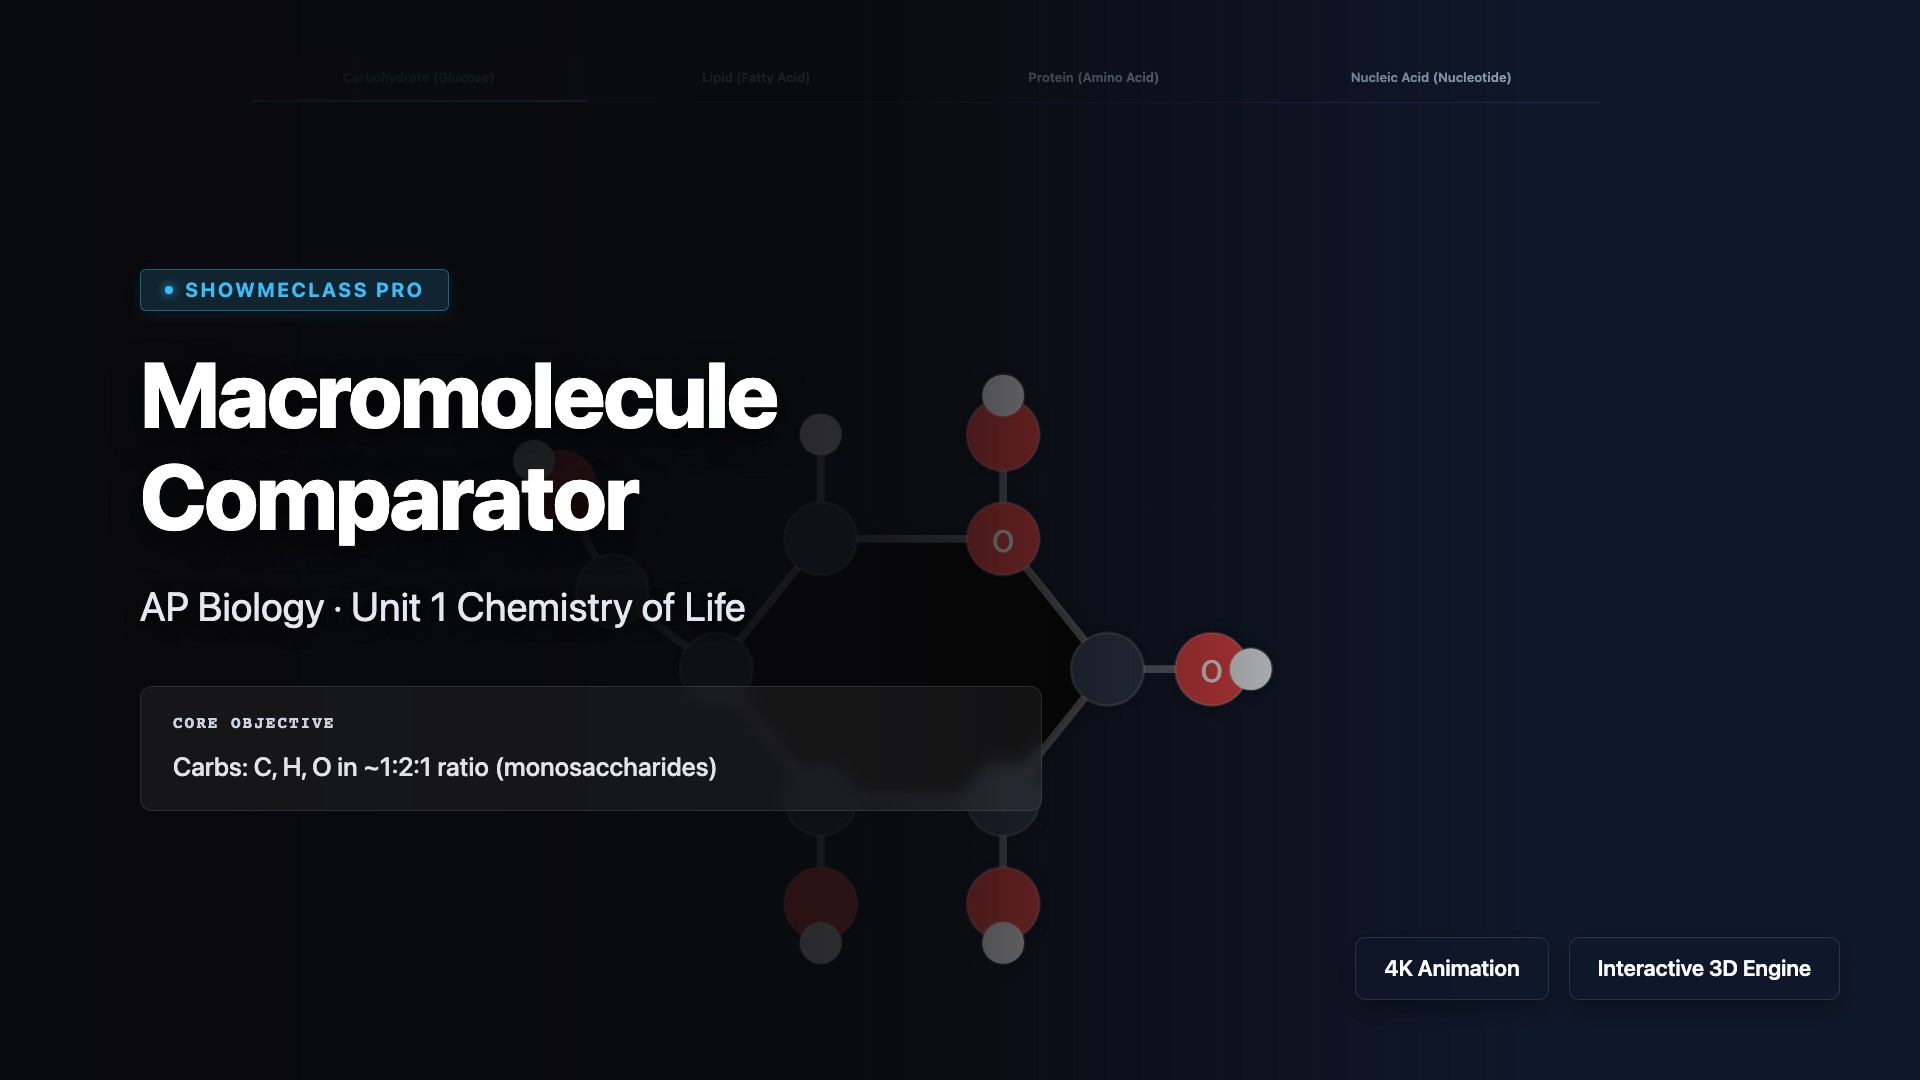
Macromolecule Structure Comparator
Compare the 2D SVG molecular structures of Carbohydrates, Lipids, Proteins, and Nucleic Acids. Identify key elements and monomers.