Showing 12 results
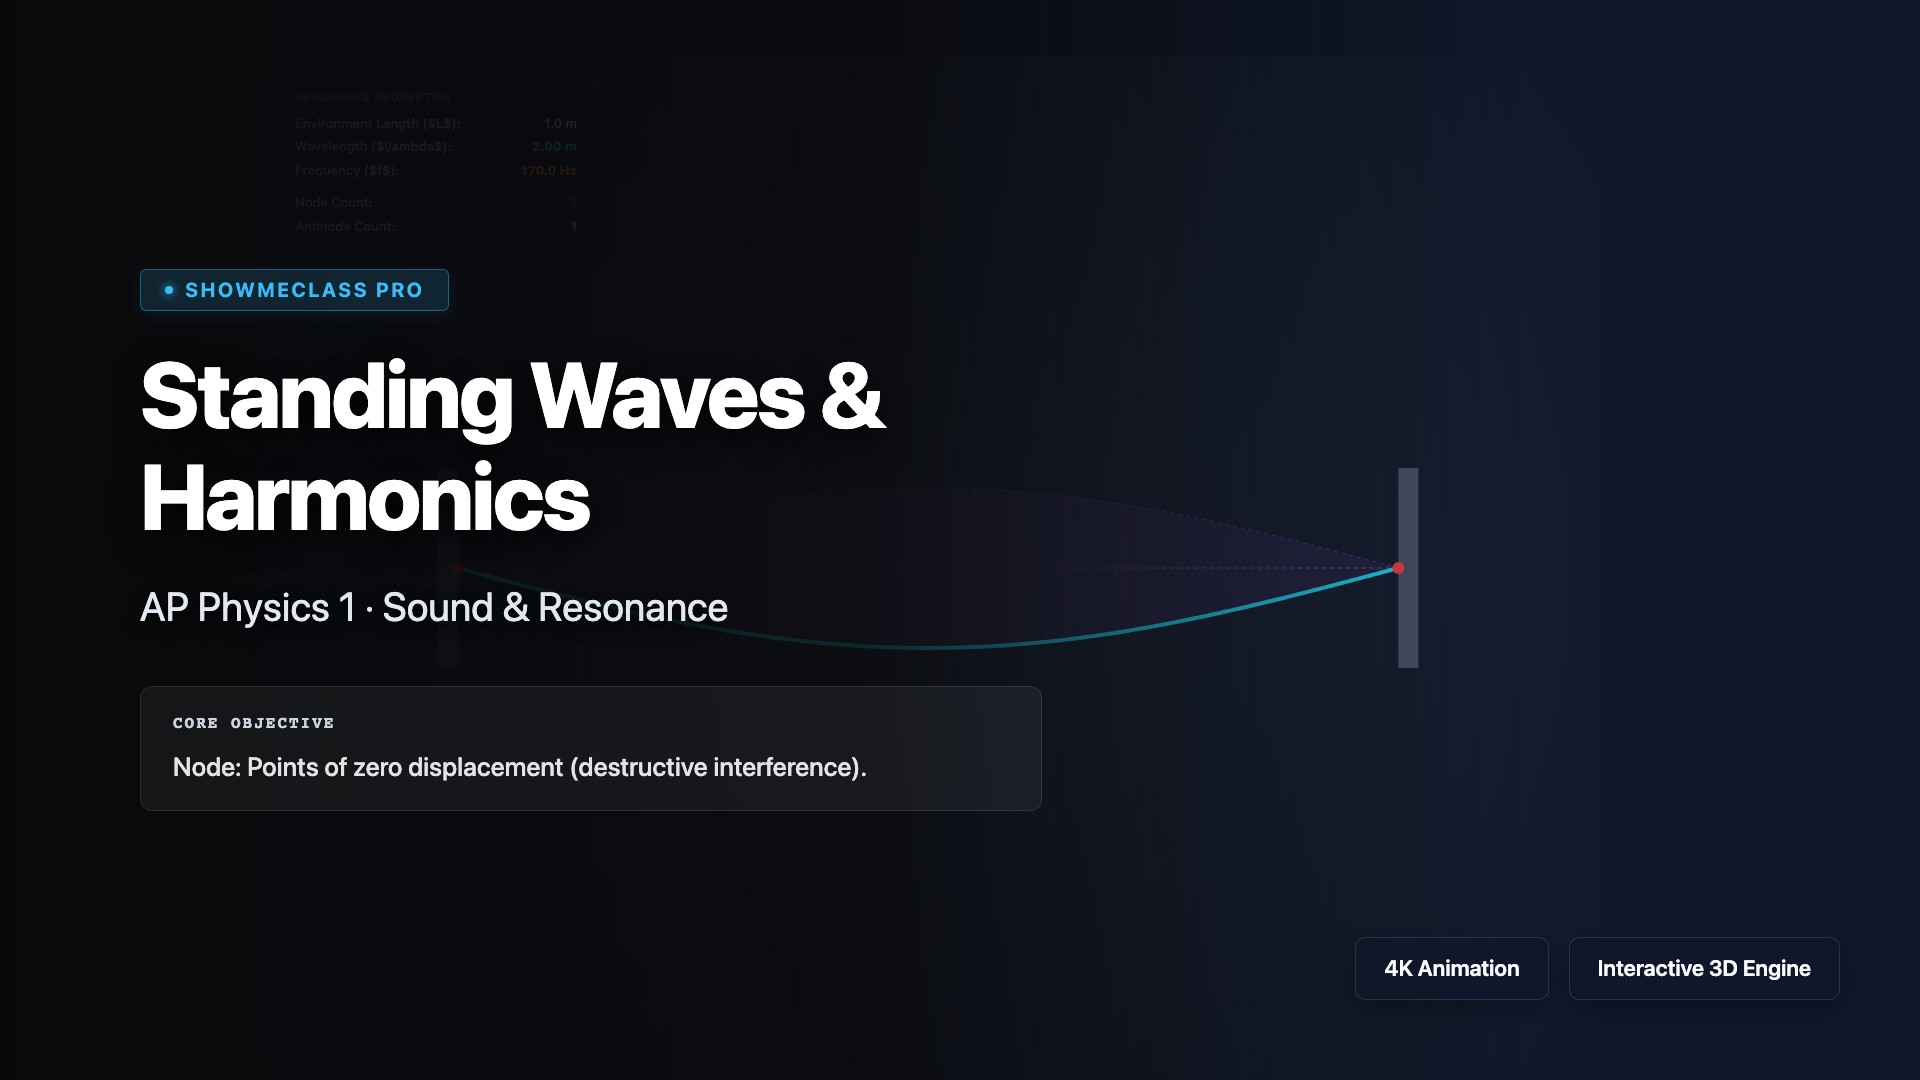
Standing Waves Generator
Visualize standing wave harmonics on a fixed string. Adjust harmonic number, amplitude, and wave speed to see nodes, antinodes, wavelength, and frequency in real time.
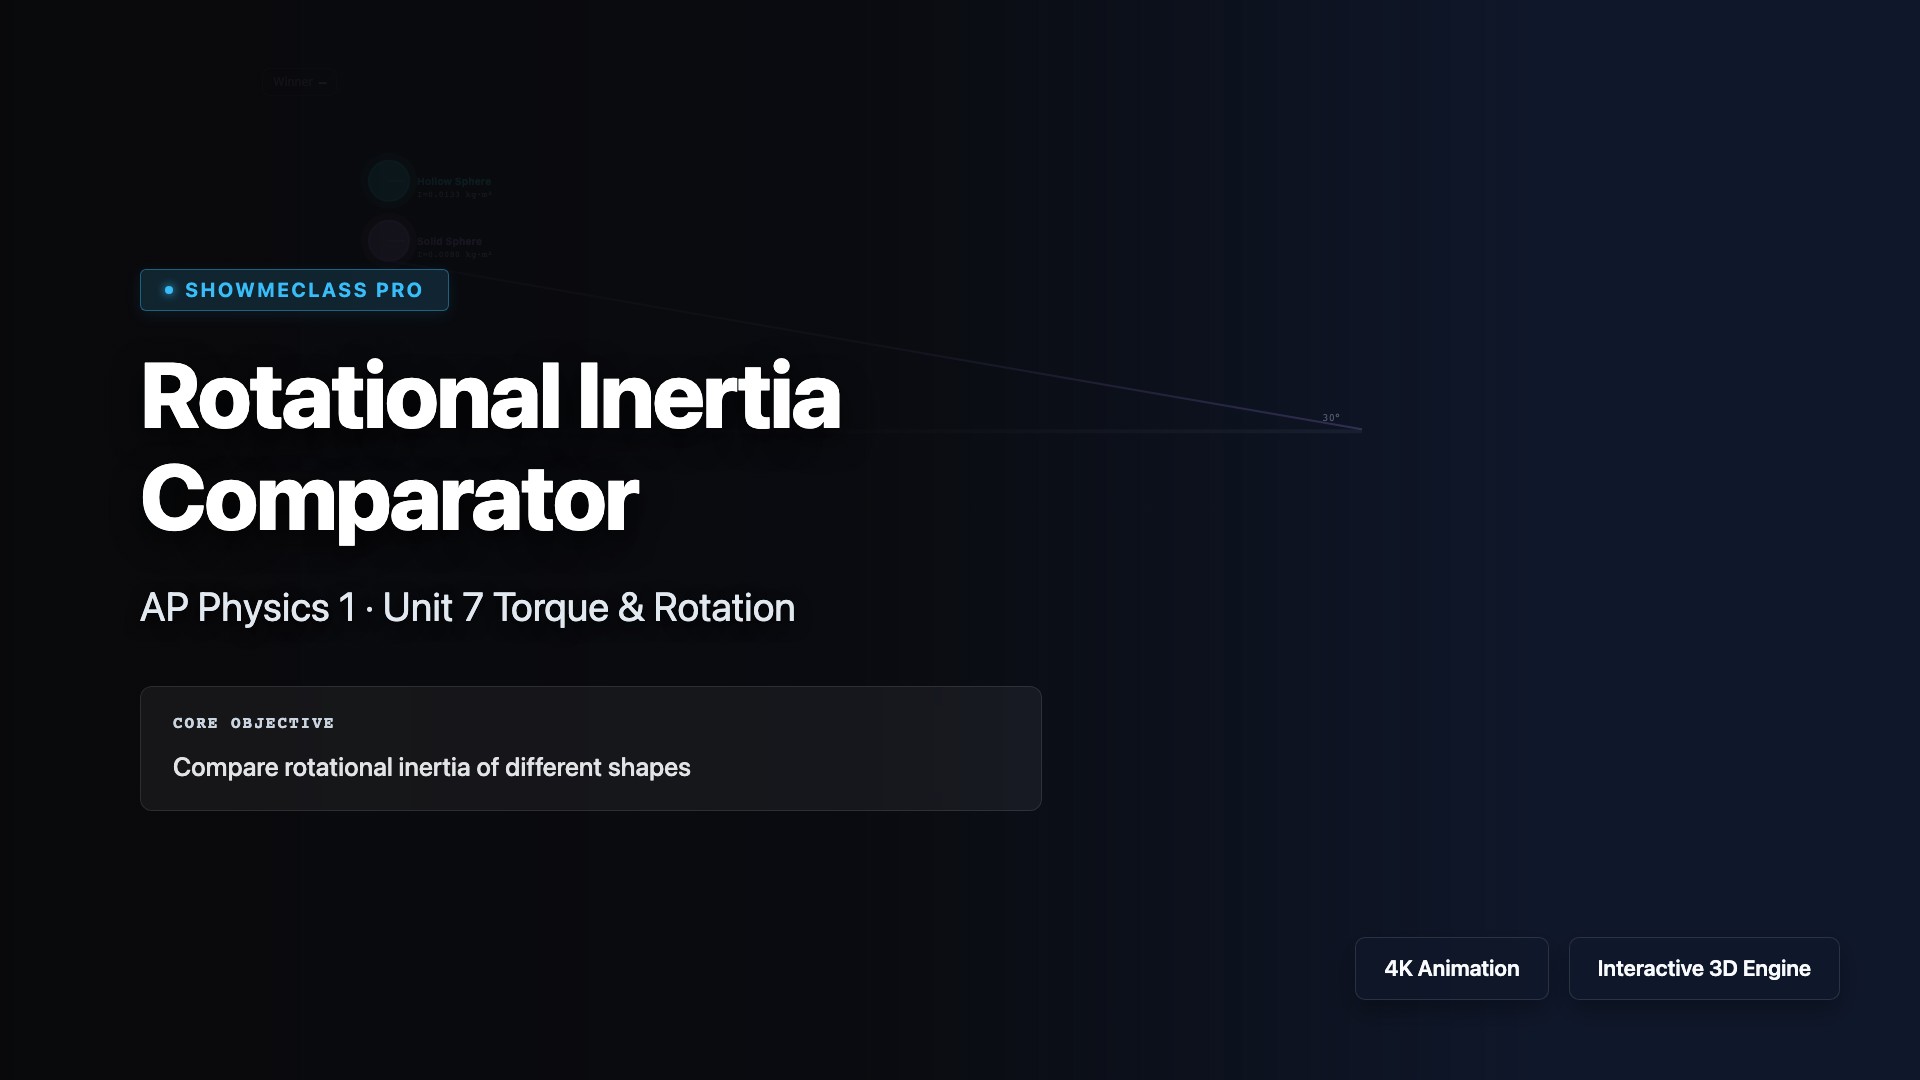
Rotational Inertia Comparator
Race shapes down a ramp to see which arrives first. Compare rotational inertia of solid/hollow spheres, cylinders, and rods. Understand how I/(mR²) determines rolling acceleration.
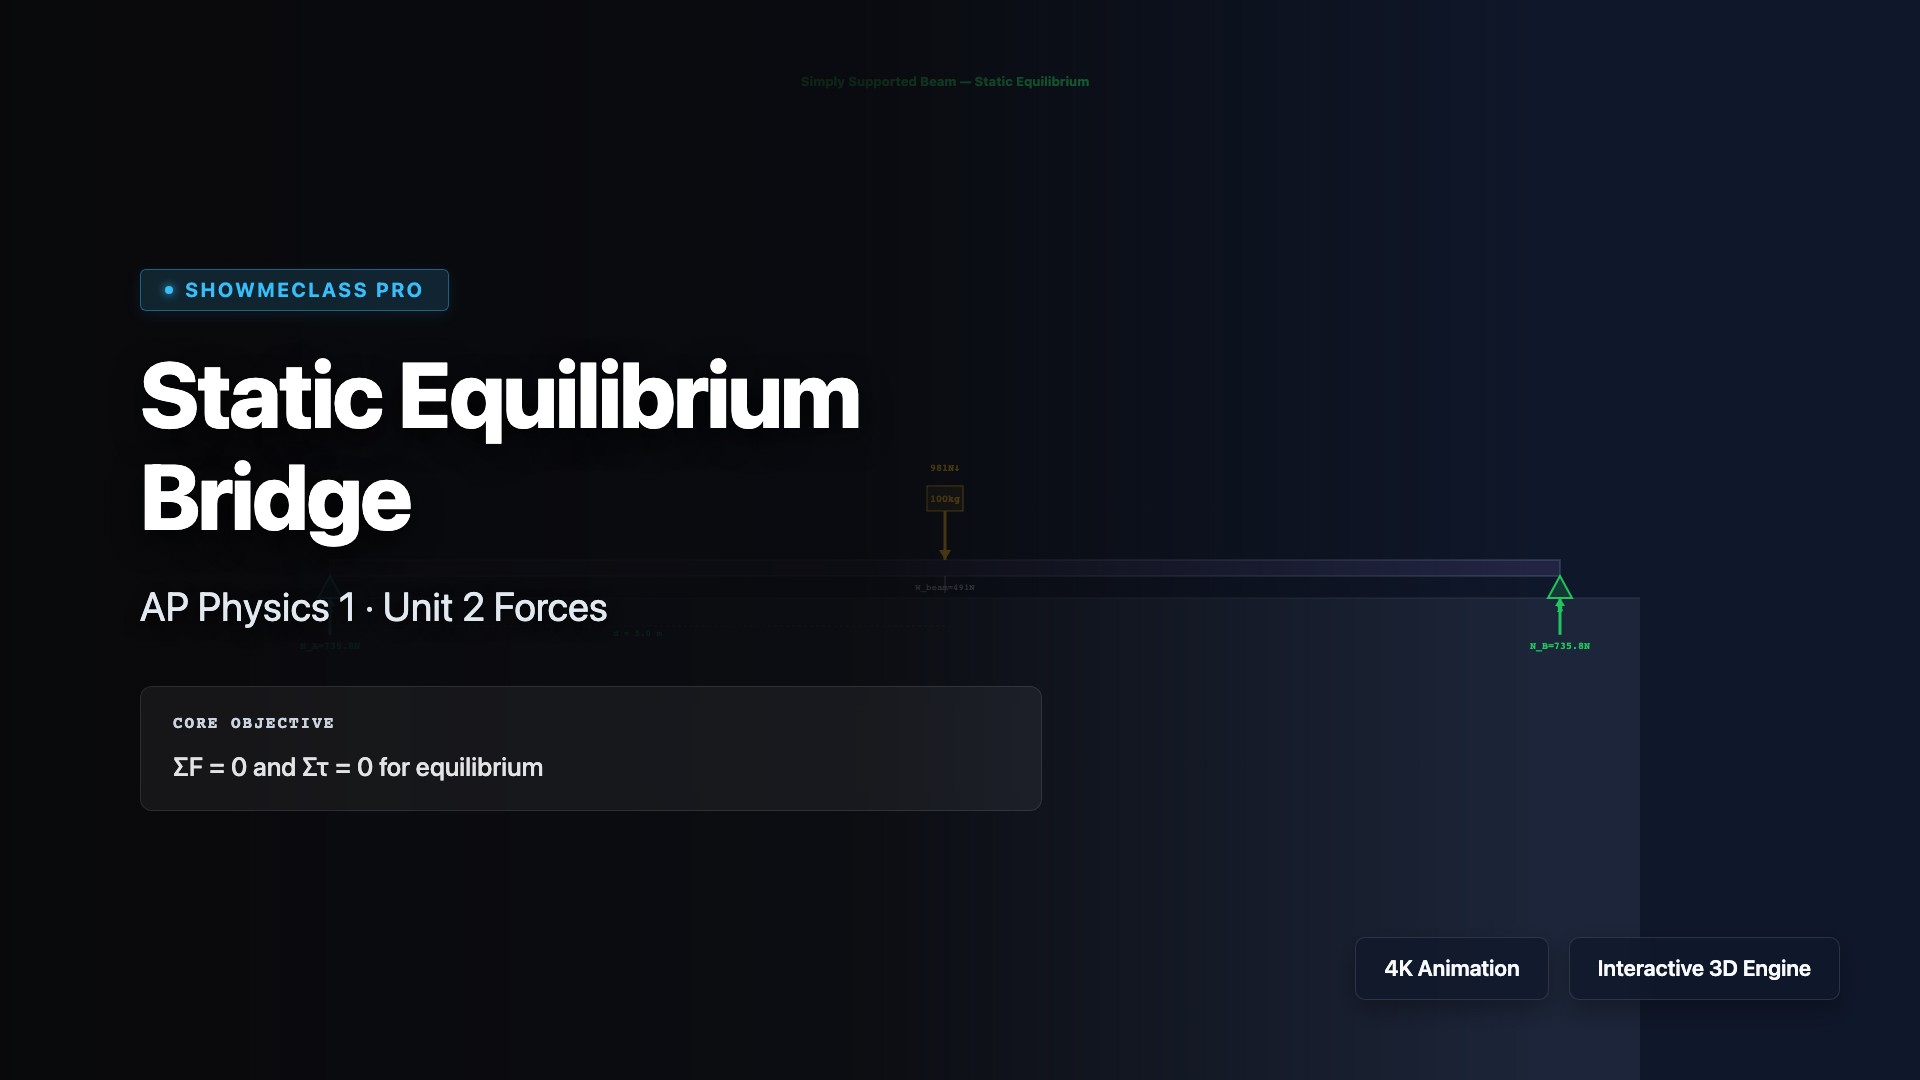
Static Equilibrium Bridge Builder
Analyze a simply supported beam with movable load. Calculate support reactions NA and NB using ΣF=0 and Στ=0 equilibrium conditions.

Pulley Systems & Mechanical Advantage
Compare 4 pulley configurations: single fixed, single movable, compound, and block & tackle. See how mechanical advantage trades force for distance.
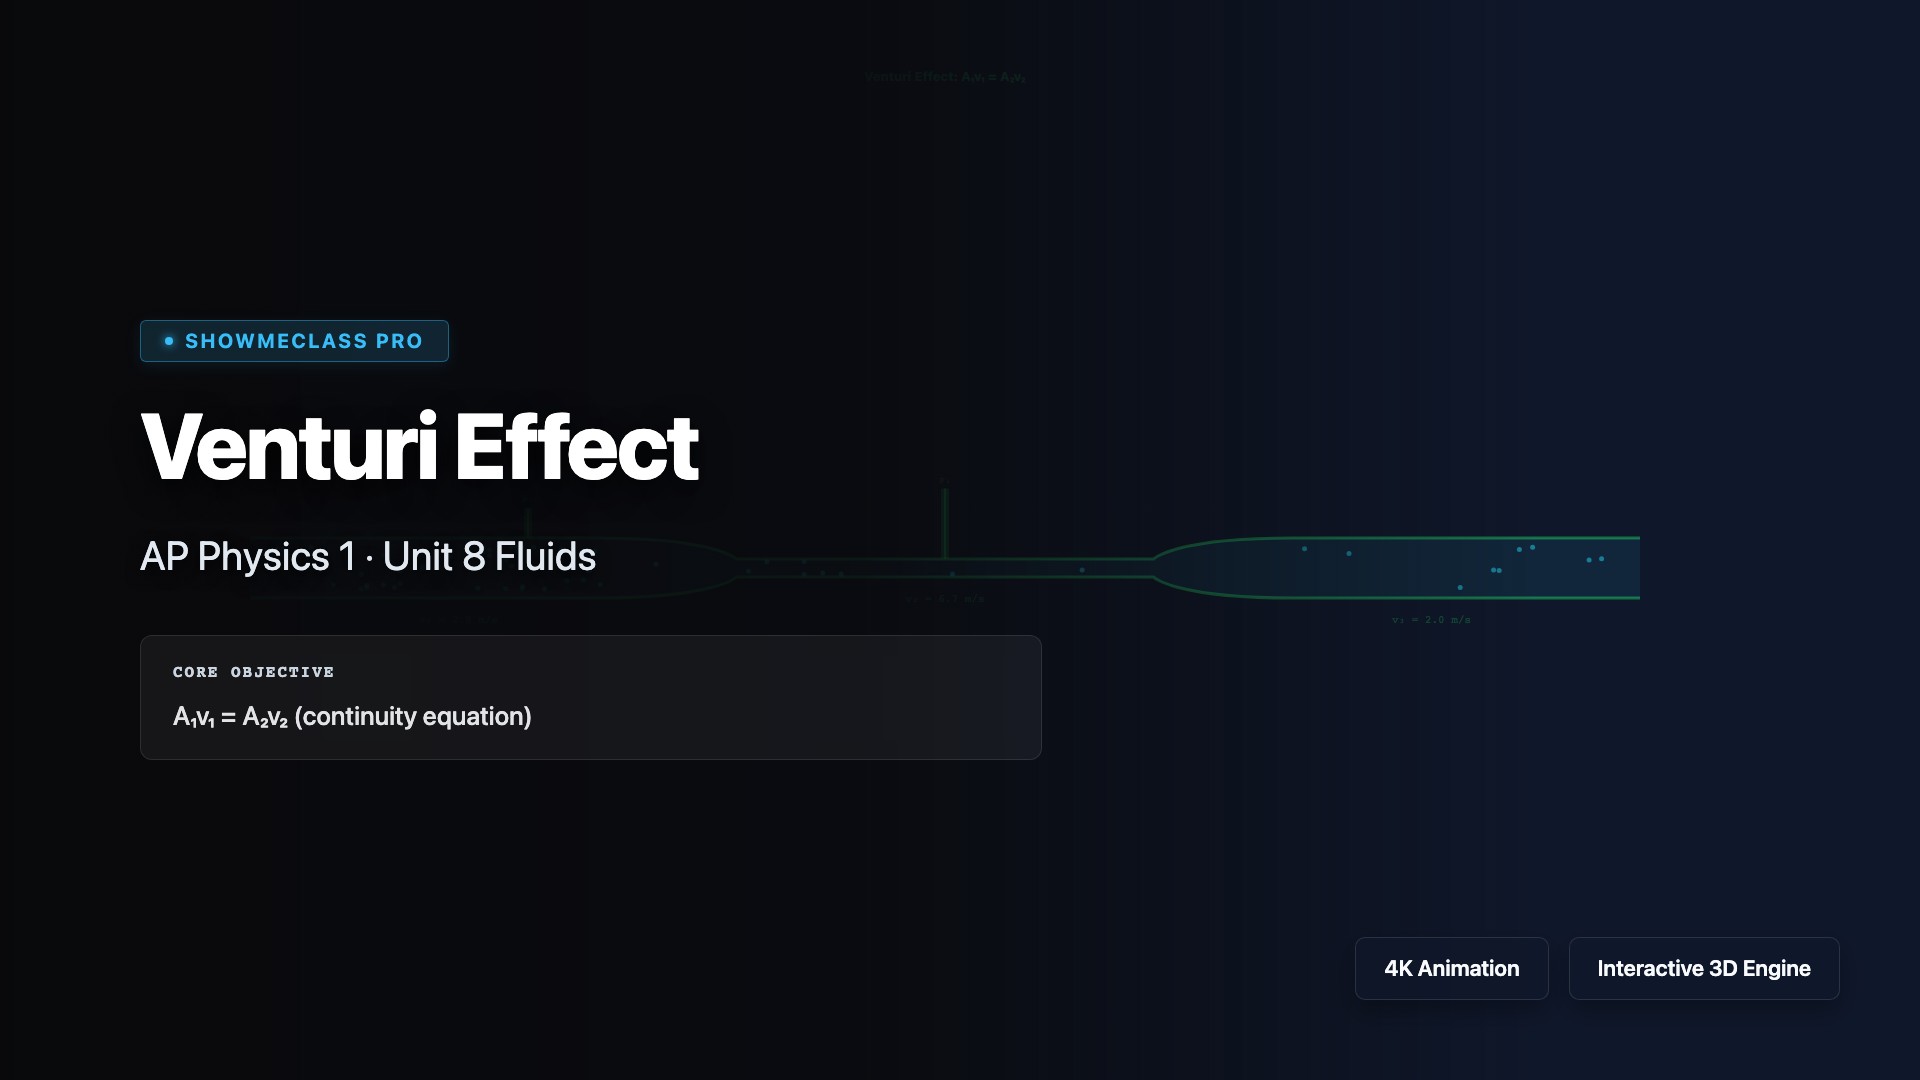
Venturi Effect & Flow Speed
Animated Venturi tube with flowing particles. A₁v₁ = A₂v₂ continuity equation and Bernoulli pressure drop visualization with manometer tubes.
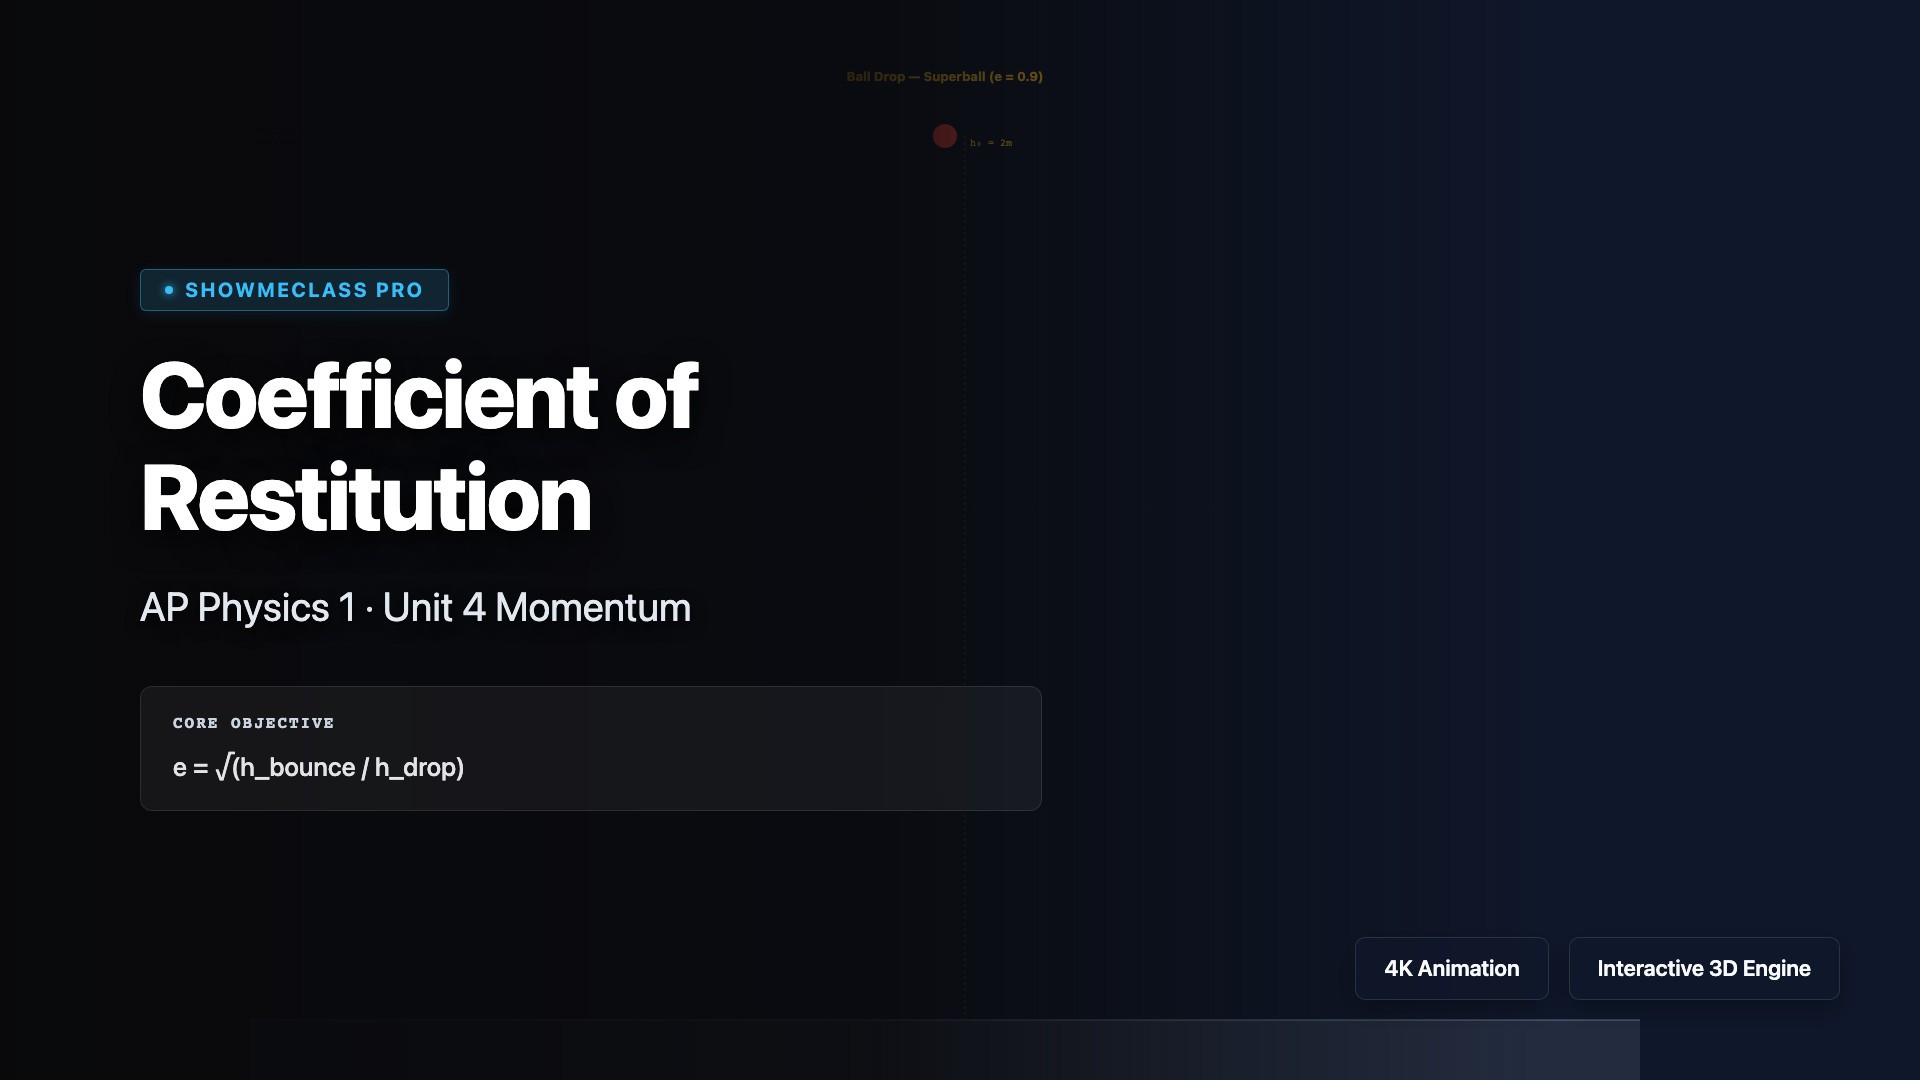
Coefficient of Restitution Lab
Drop balls of 6 materials (superball to clay) and measure bounce height to calculate e = √(h_bounce/h_drop). Compare energy lost per bounce.
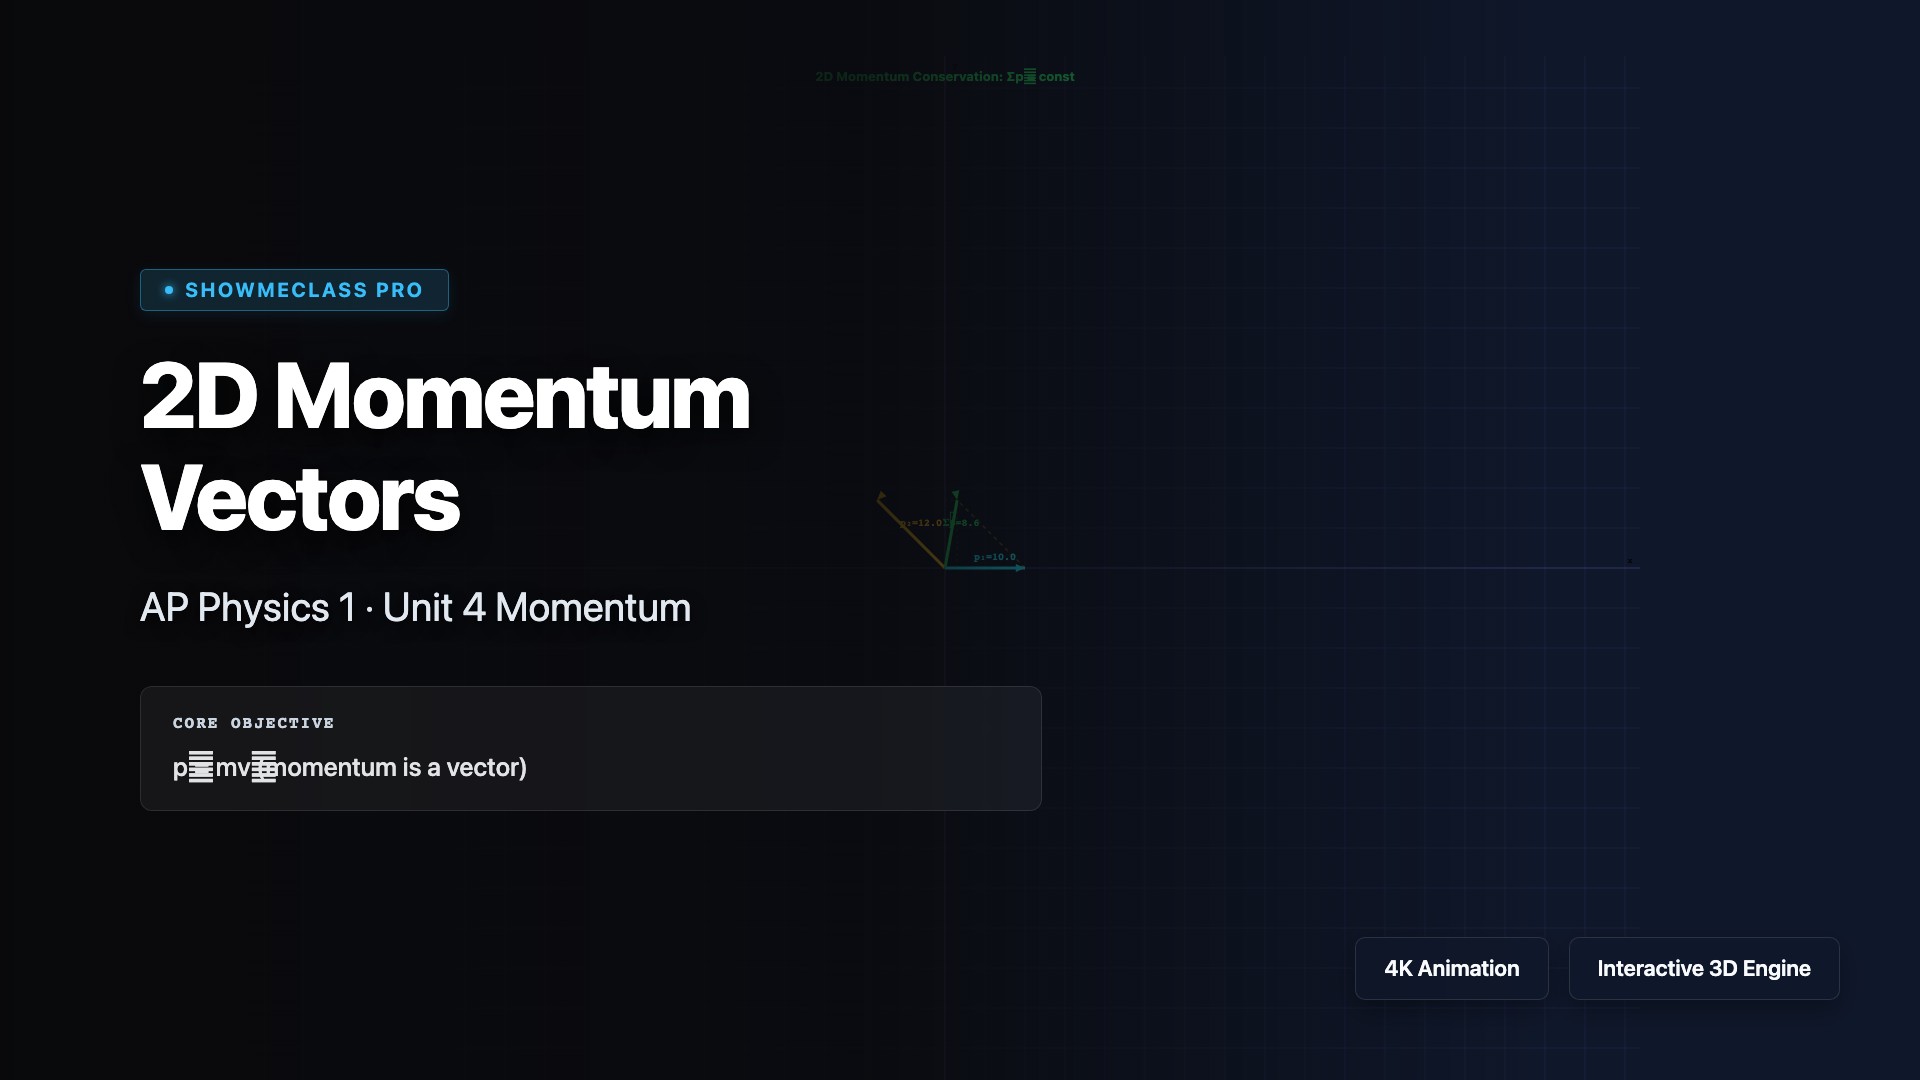
2D Momentum Vector Addition
Adjust mass, speed, and angle of two objects to see 2D momentum vector addition. Tail-to-tip method shows total momentum conservation with x/y components.
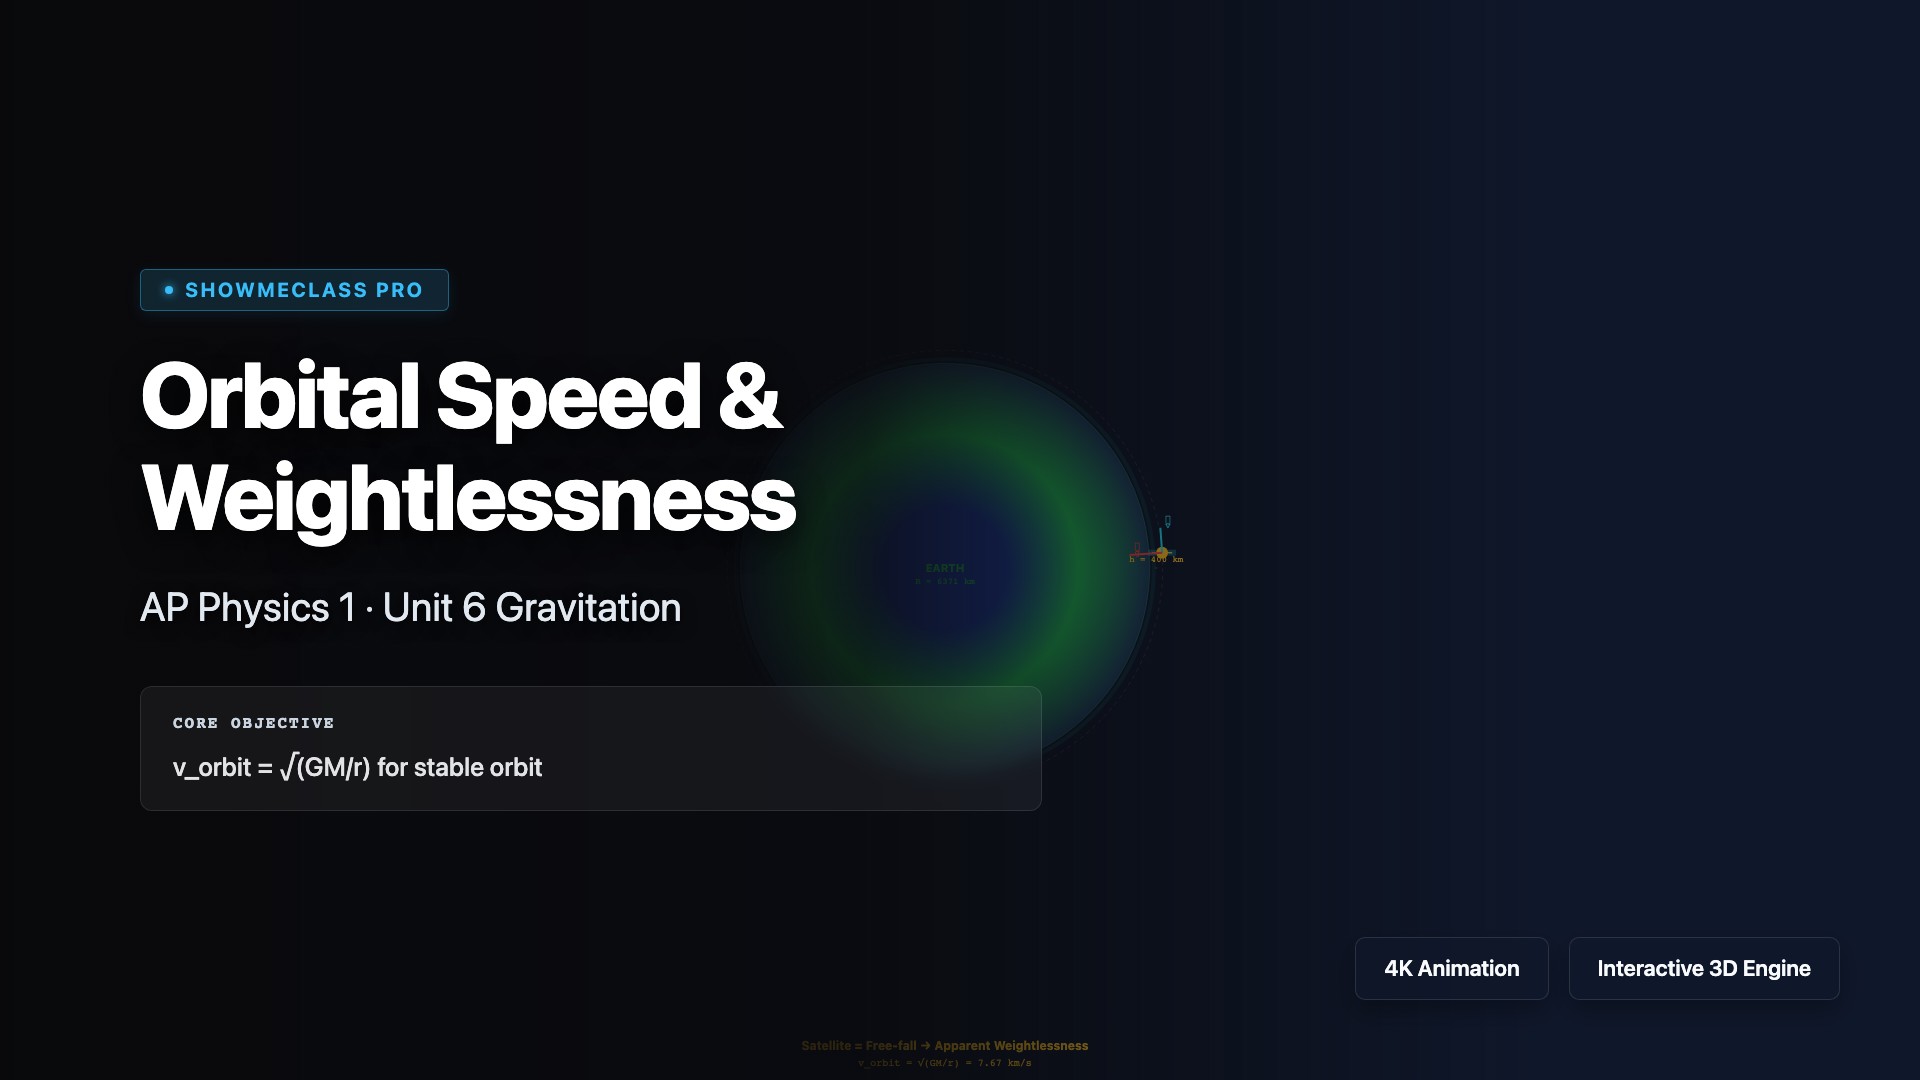
Orbital Speed & Weightlessness
Animated satellite orbiting Earth. v_orbit = √(GM/r). Adjust altitude from LEO to GEO to see speed, period, and local g. Free-fall = apparent weightlessness.
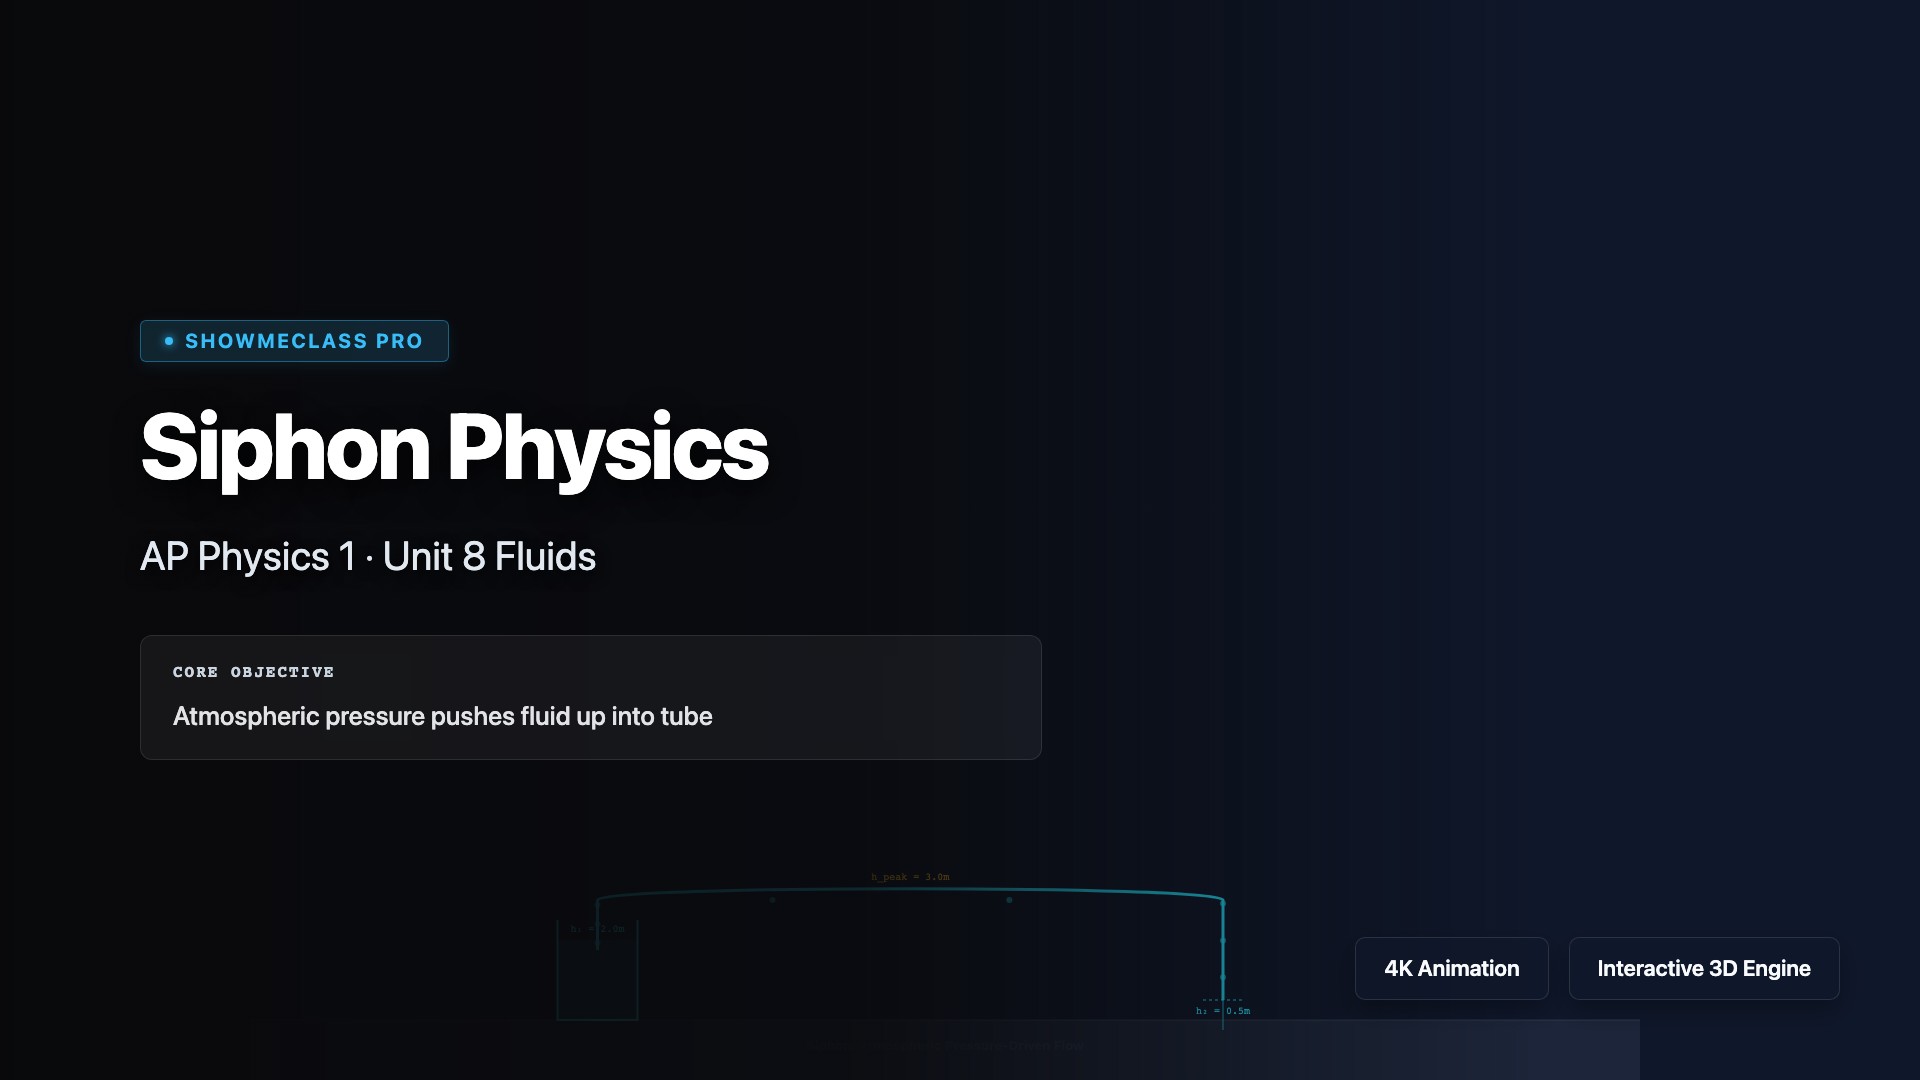
Siphon Physics Simulator
Atmospheric pressure drives fluid over barrier. Adjust source/outlet heights and tube peak. v = √(2g·Δh). Warning at 10.3m atmospheric limit.
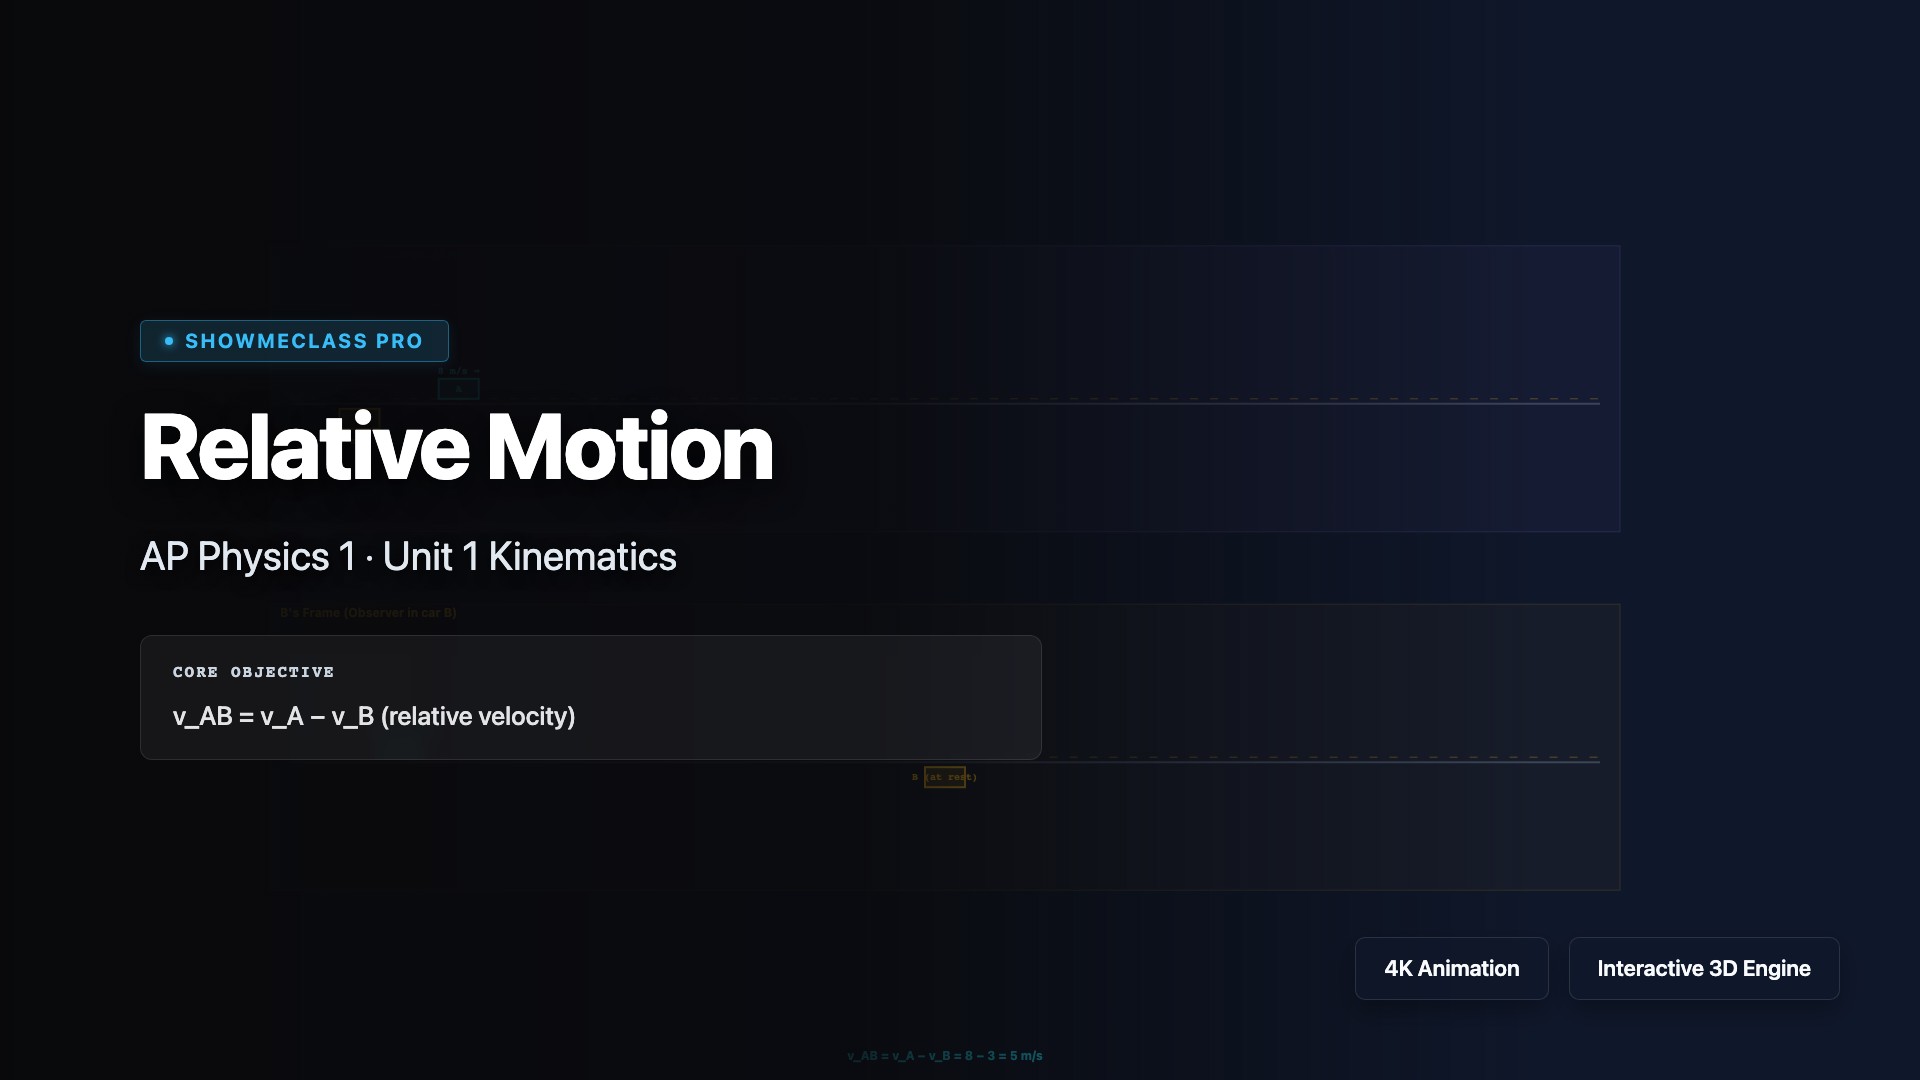
Relative Motion & Reference Frames
Compare same motion from ground frame vs moving observer frame. v_AB = v_A − v_B. Two cars animated side-by-side in both perspectives.

Kirchhoff's Rules Circuit Solver
Solve a two-loop circuit using Kirchhoff's voltage and current laws. Adjust EMFs and resistances to see real-time current calculations with KVL/KCL equation display.
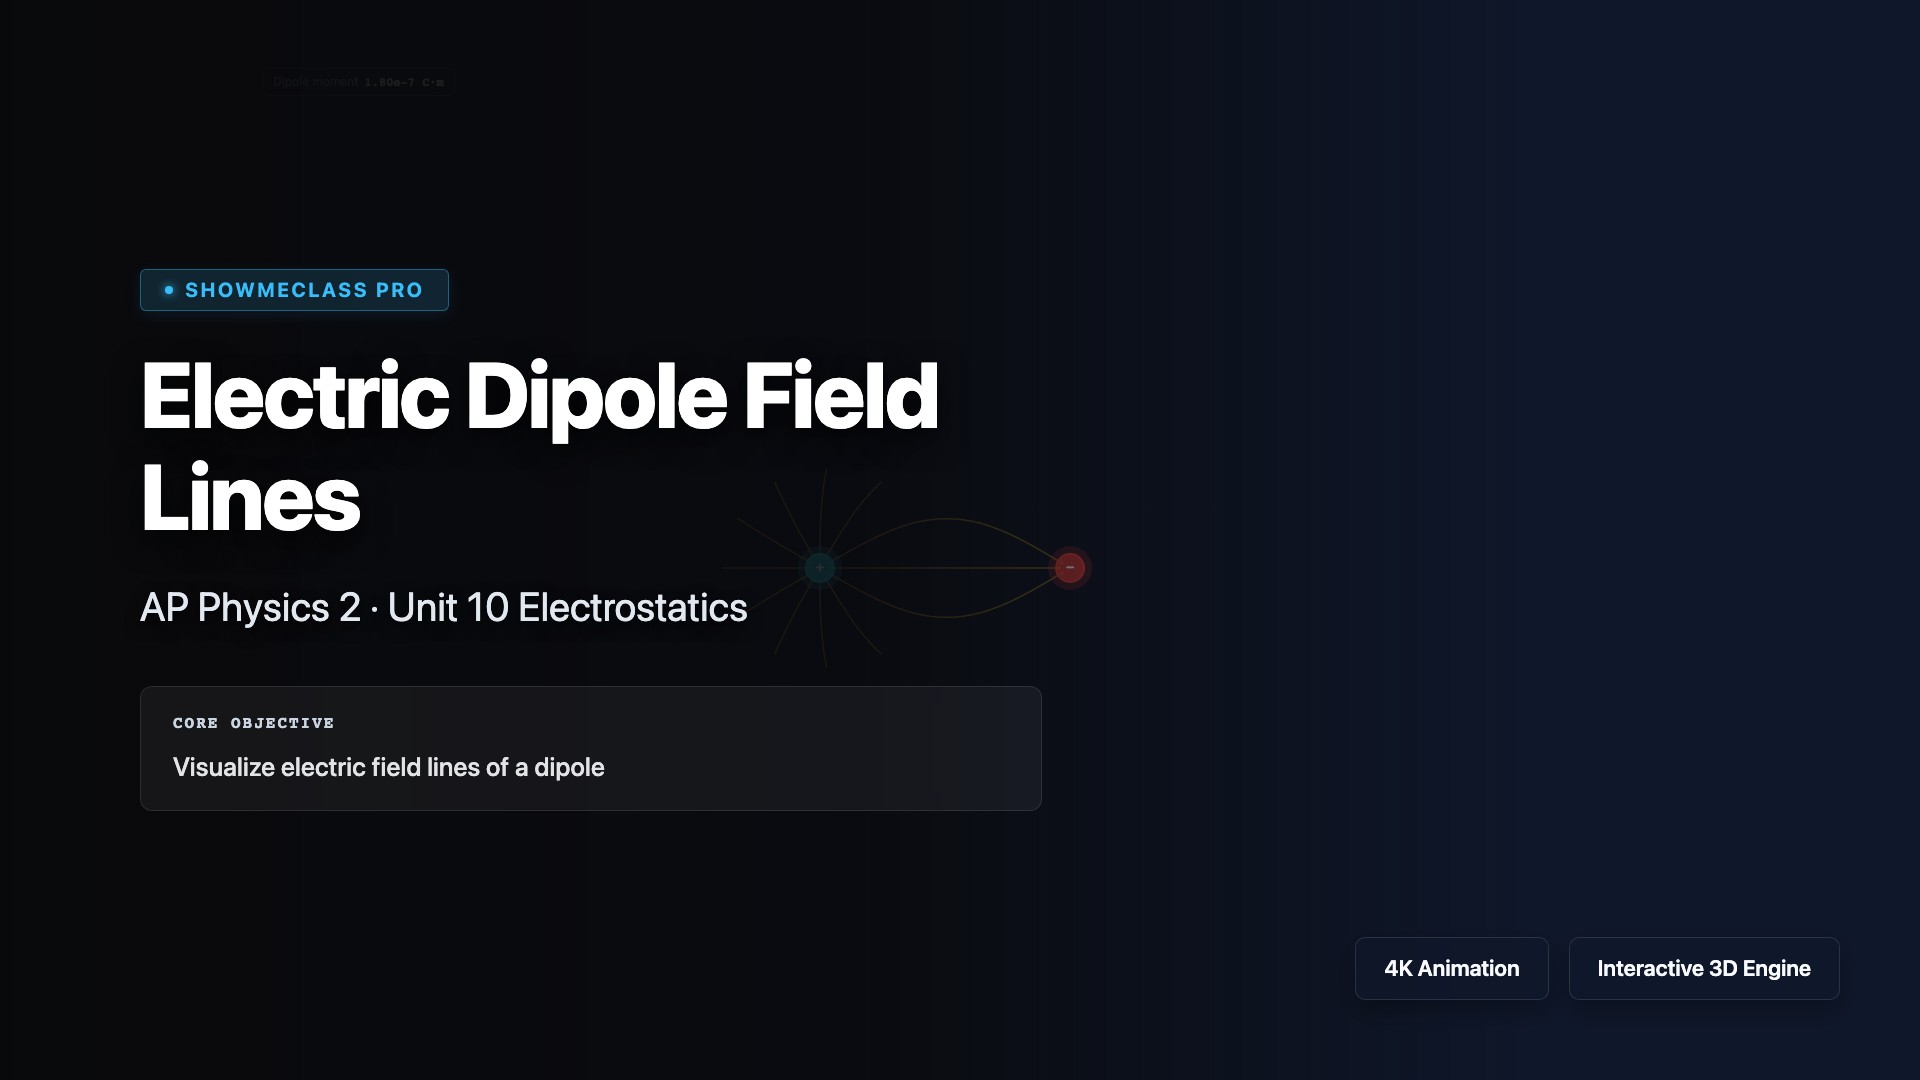
Electric Dipole Field Lines
Visualize the electric field lines and equipotential surfaces of an electric dipole. Trace field lines from positive to negative charge with adjustable charge and separation.