Showing 12 results
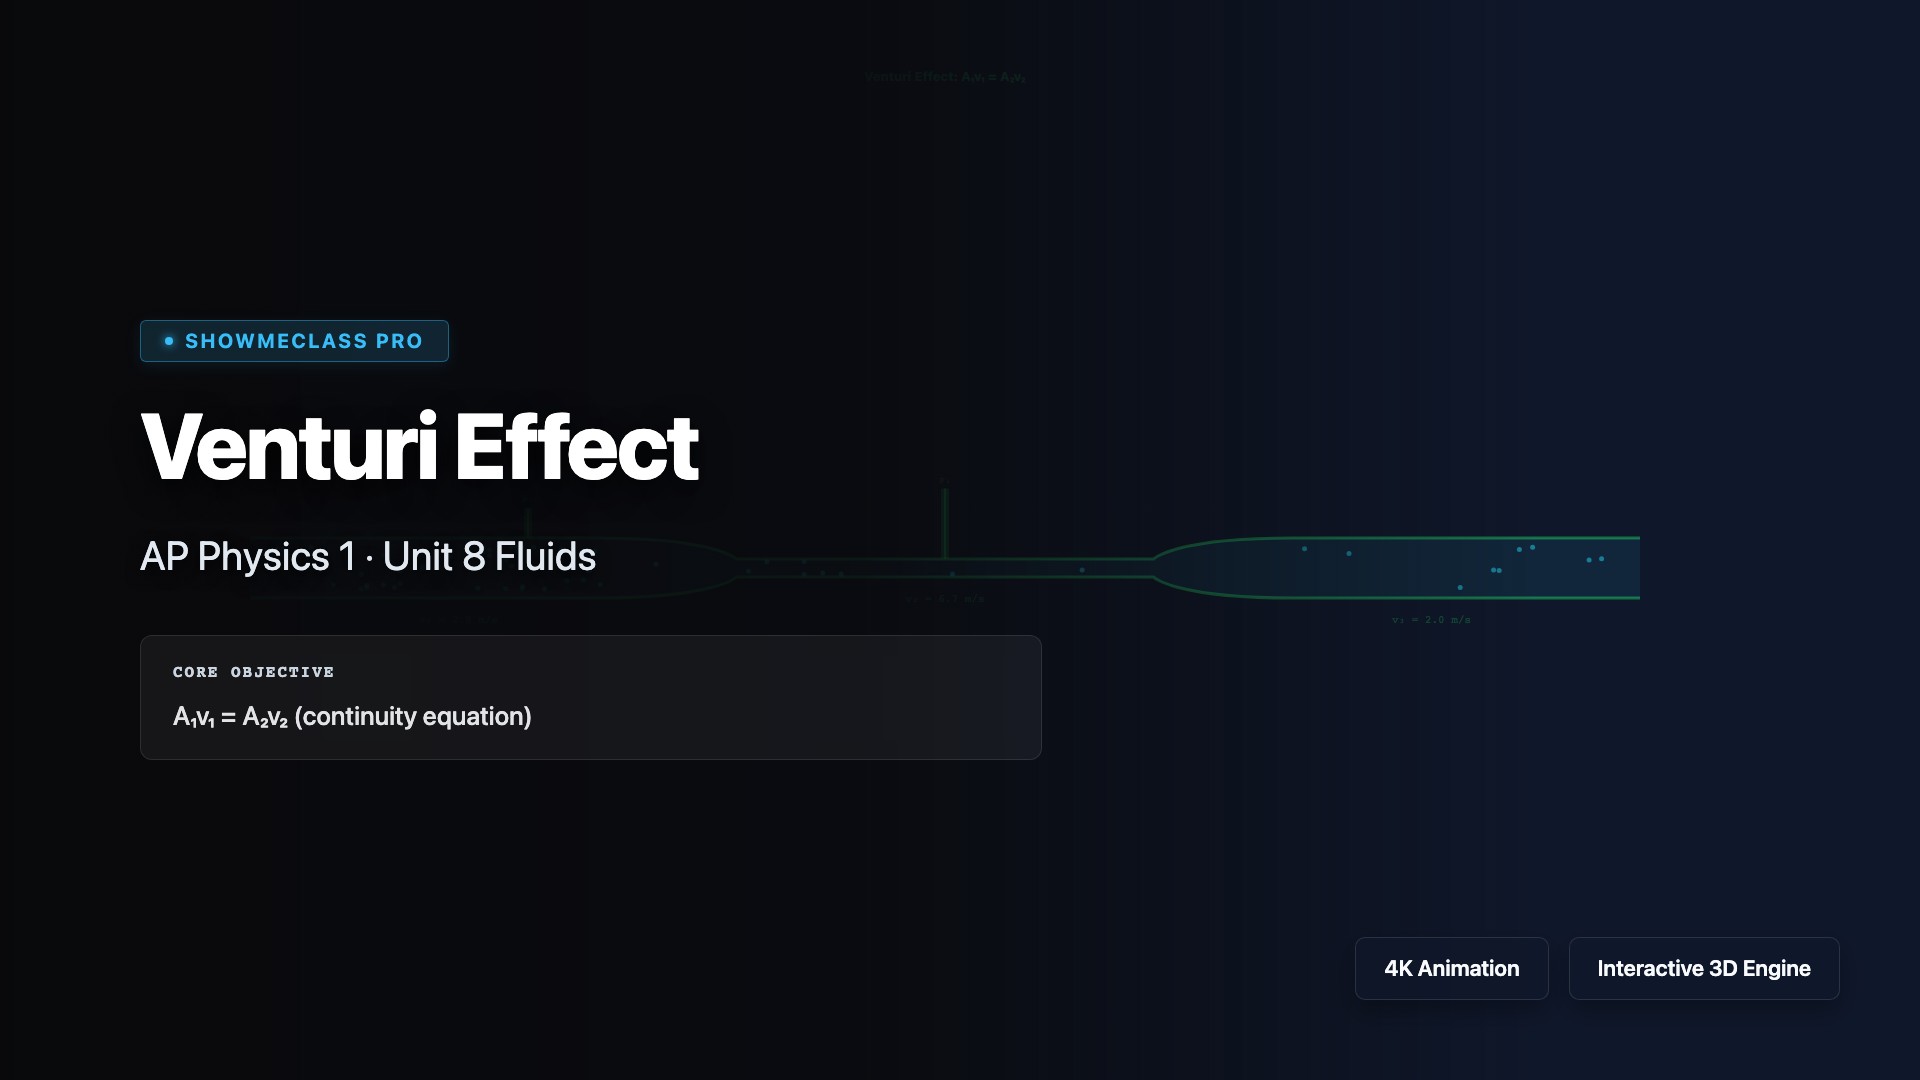
Venturi Effect & Flow Speed
Animated Venturi tube with flowing particles. A₁v₁ = A₂v₂ continuity equation and Bernoulli pressure drop visualization with manometer tubes.
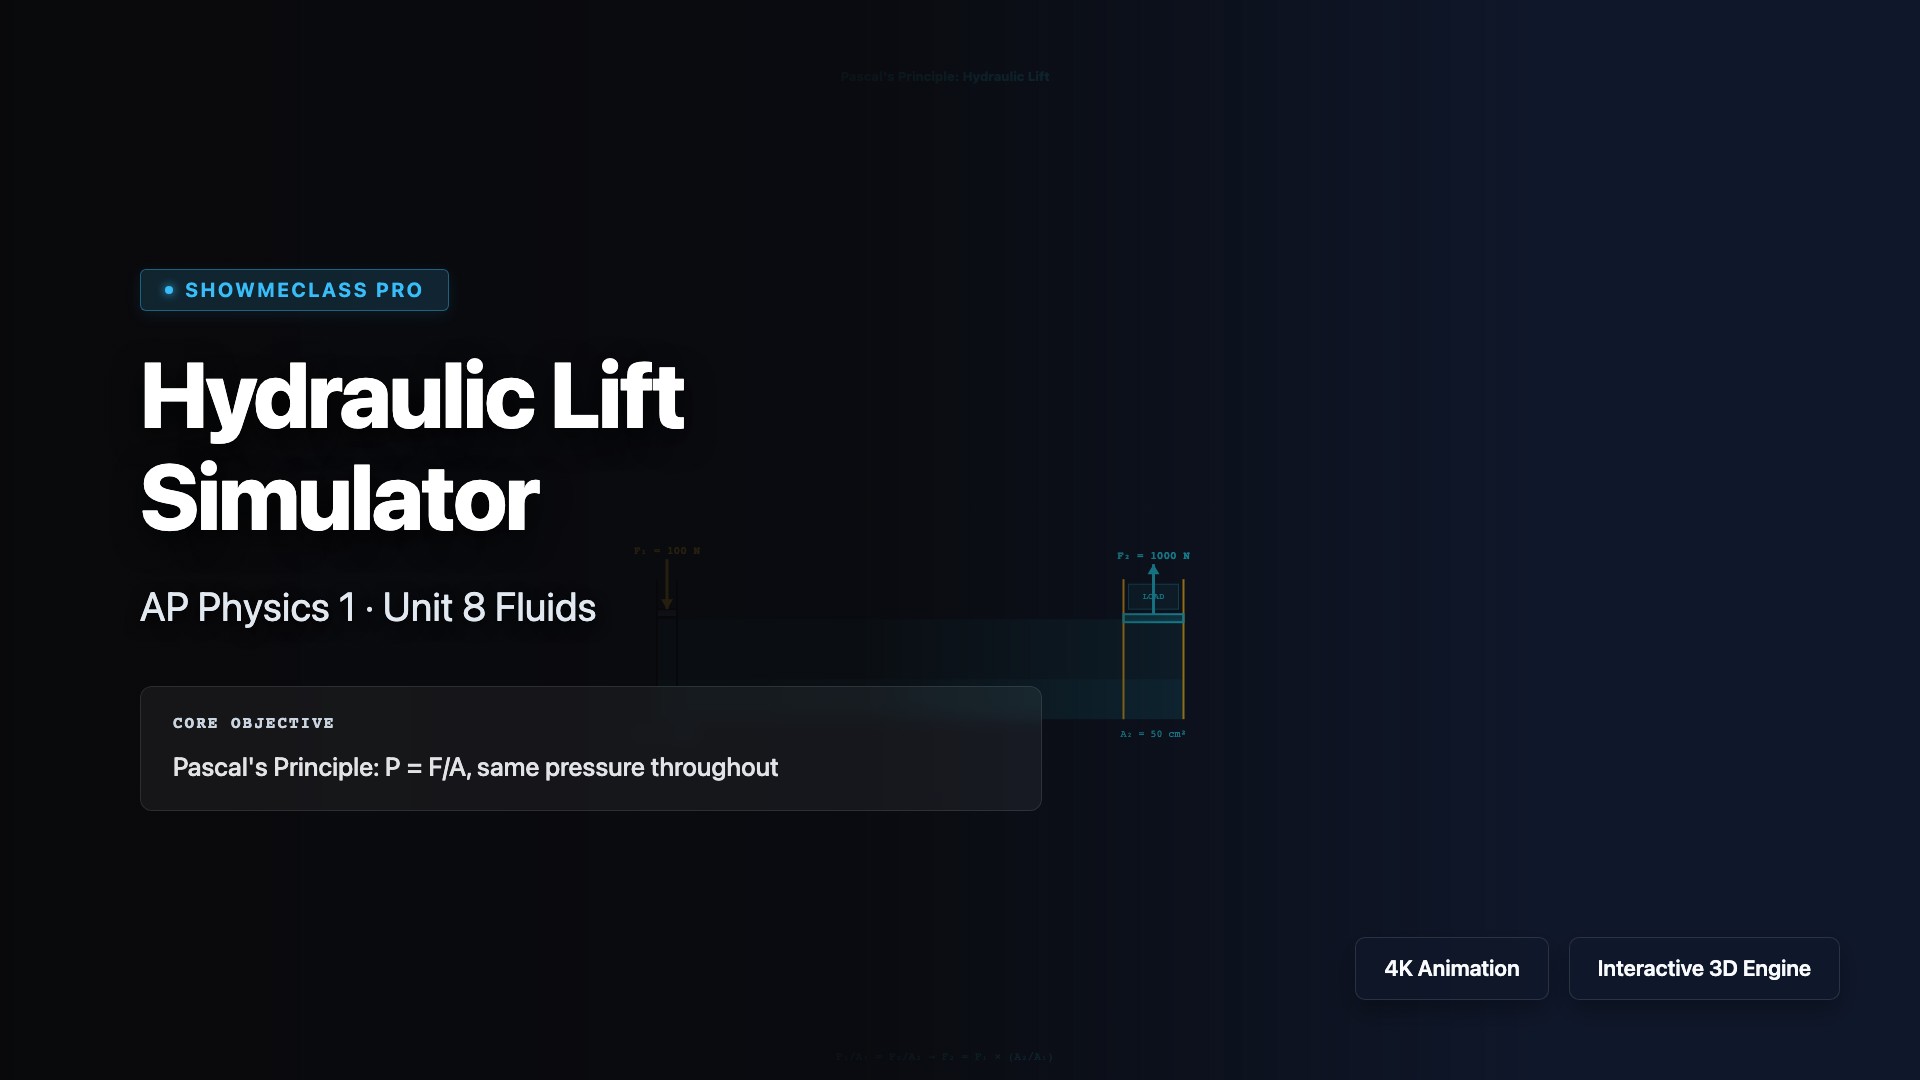
Hydraulic Lift Simulator
Pascal's Principle in action: F₁/A₁ = F₂/A₂. Visualize how a small piston force creates a much larger output force. Shows MA = A₂/A₁.
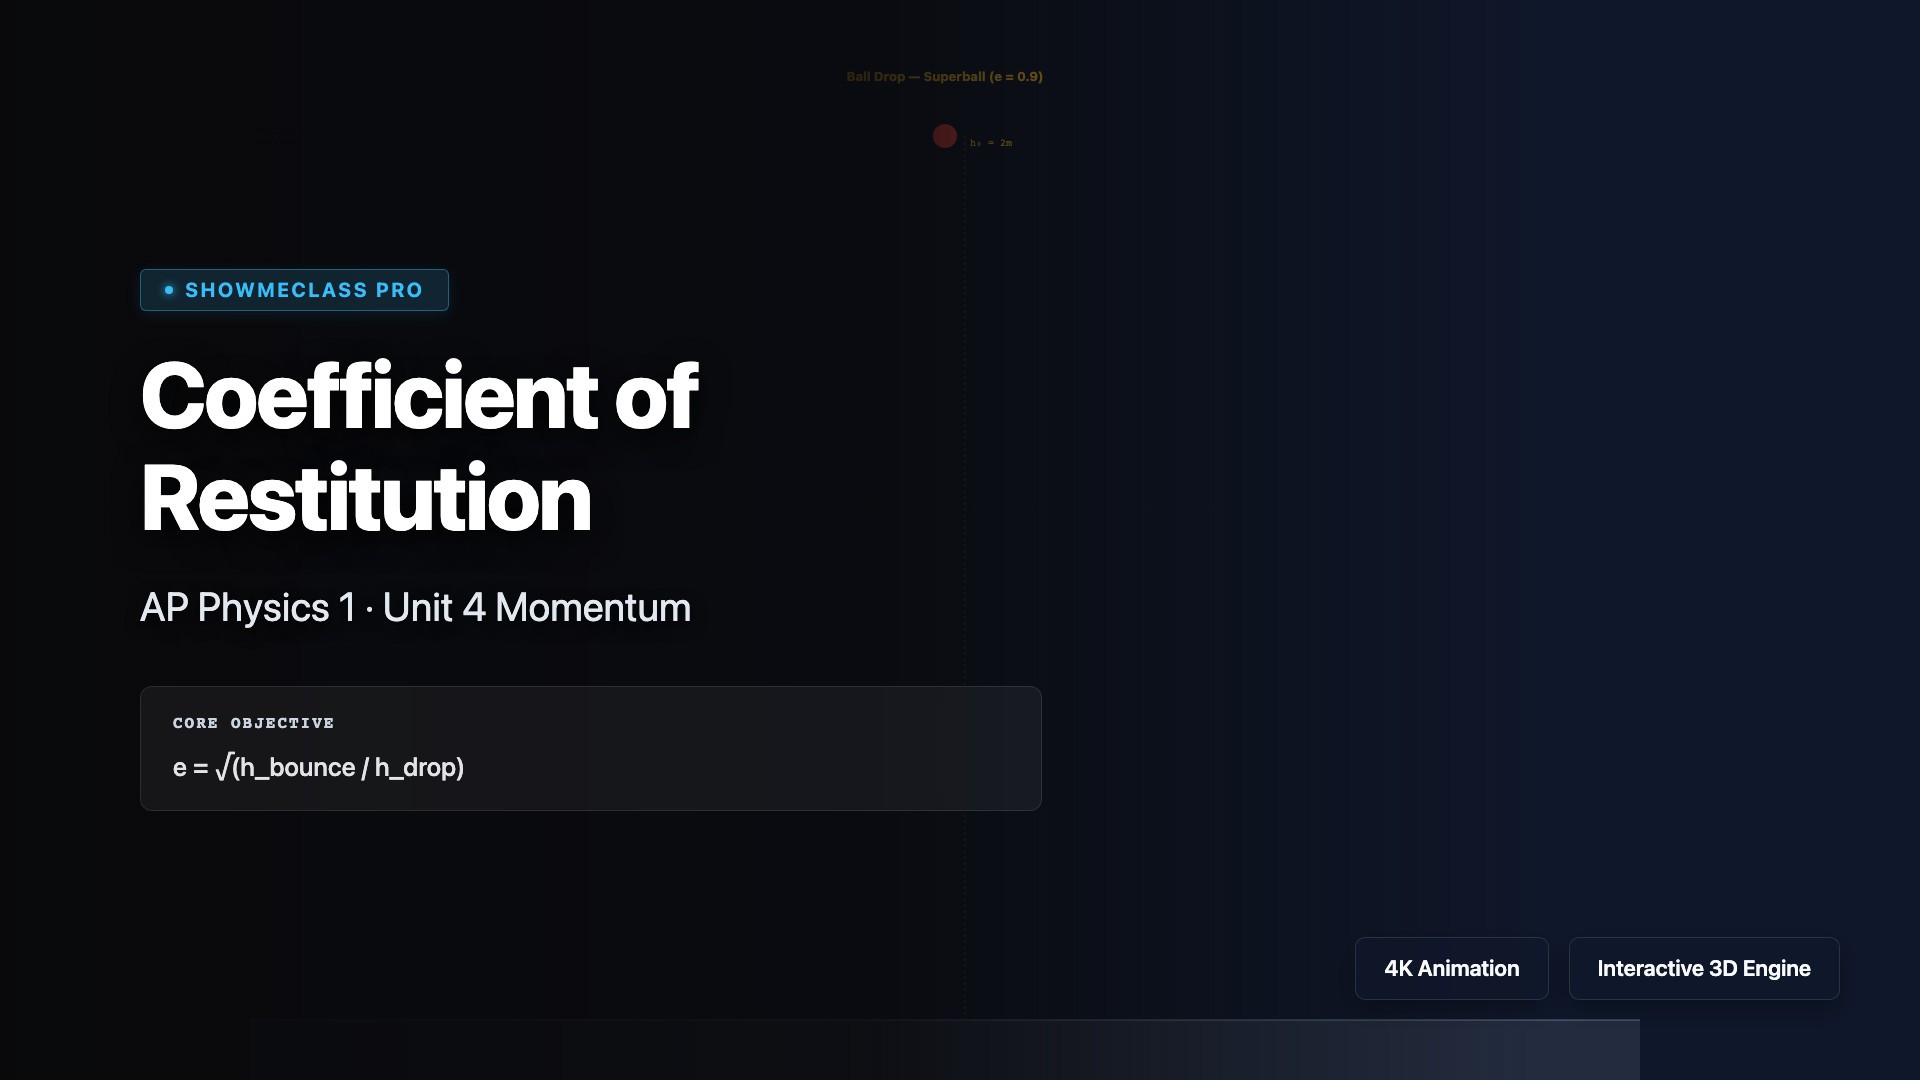
Coefficient of Restitution Lab
Drop balls of 6 materials (superball to clay) and measure bounce height to calculate e = √(h_bounce/h_drop). Compare energy lost per bounce.
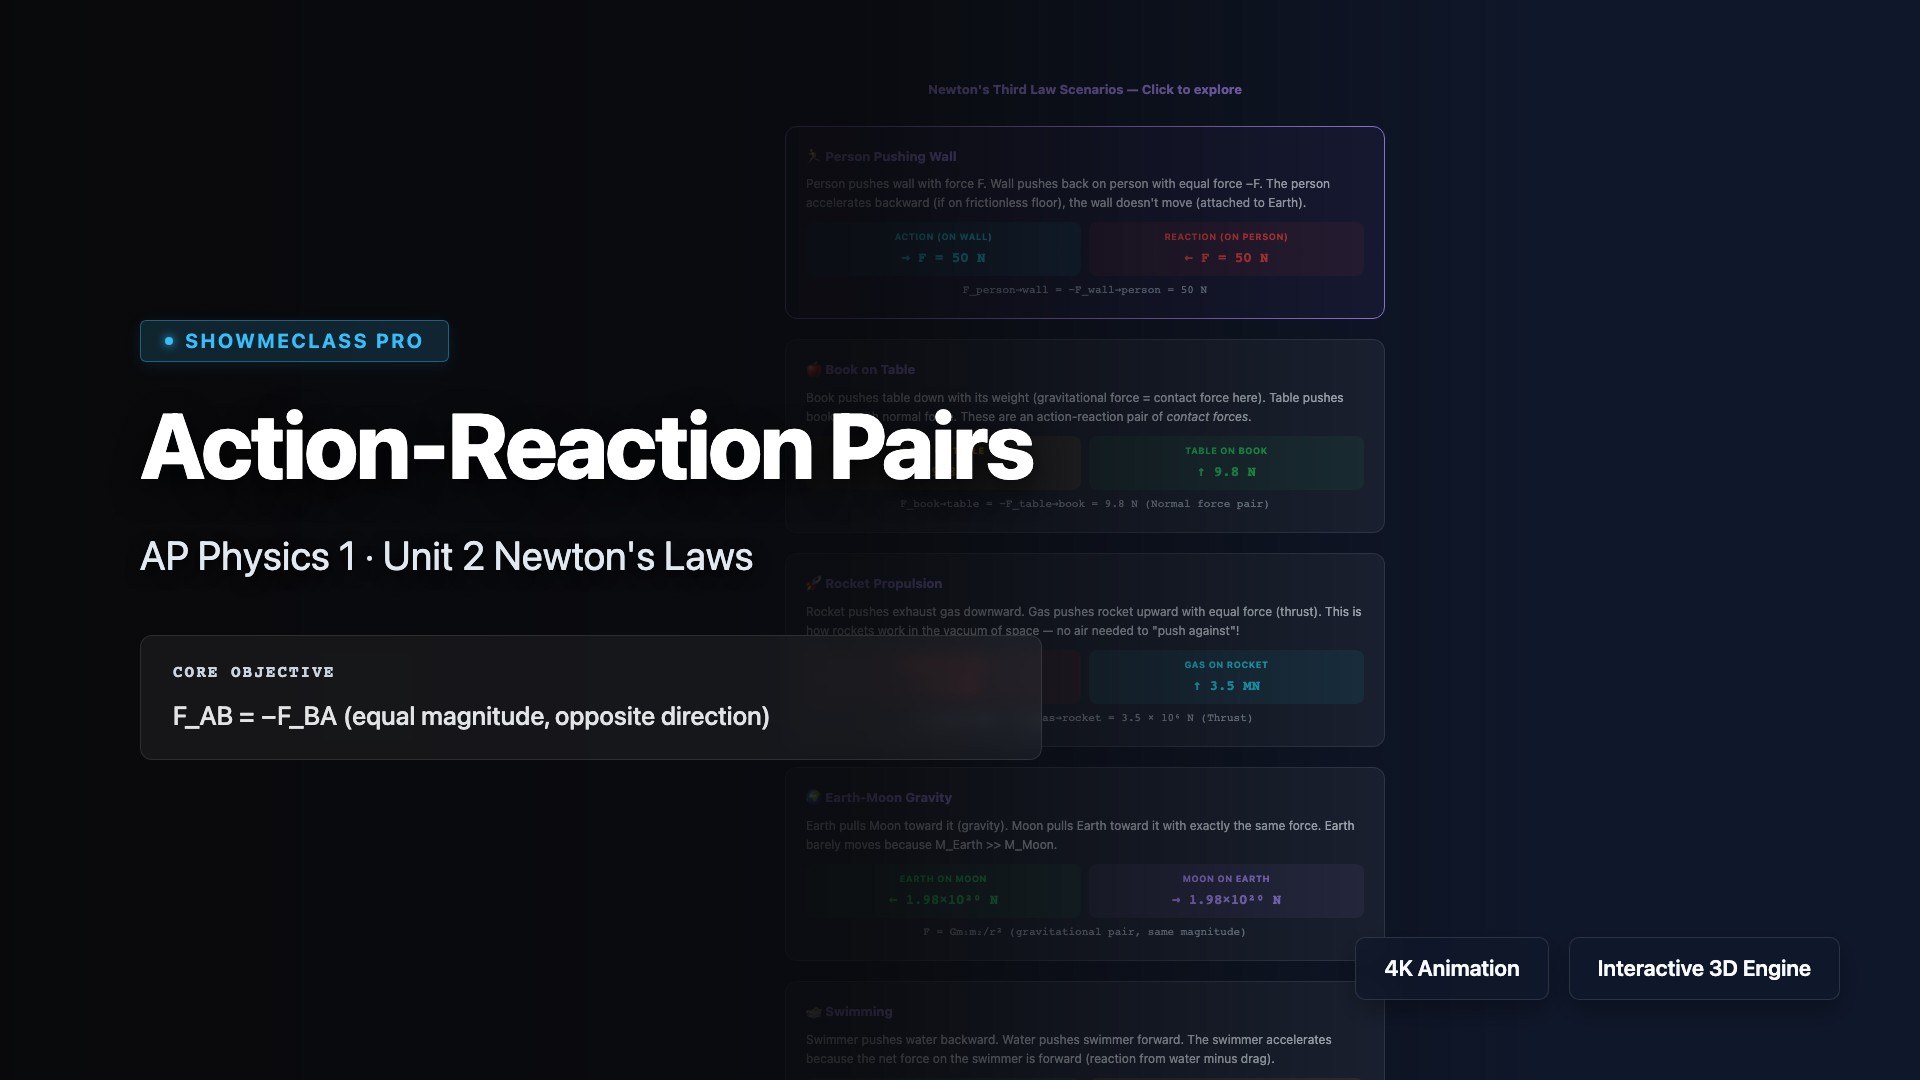
Newton's Third Law Action-Reaction Pairs
Explore 5 scenarios demonstrating F_AB = −F_BA: pushing a wall, book on table, rocket propulsion, Earth-Moon gravity, and swimming. Forces act on different objects.
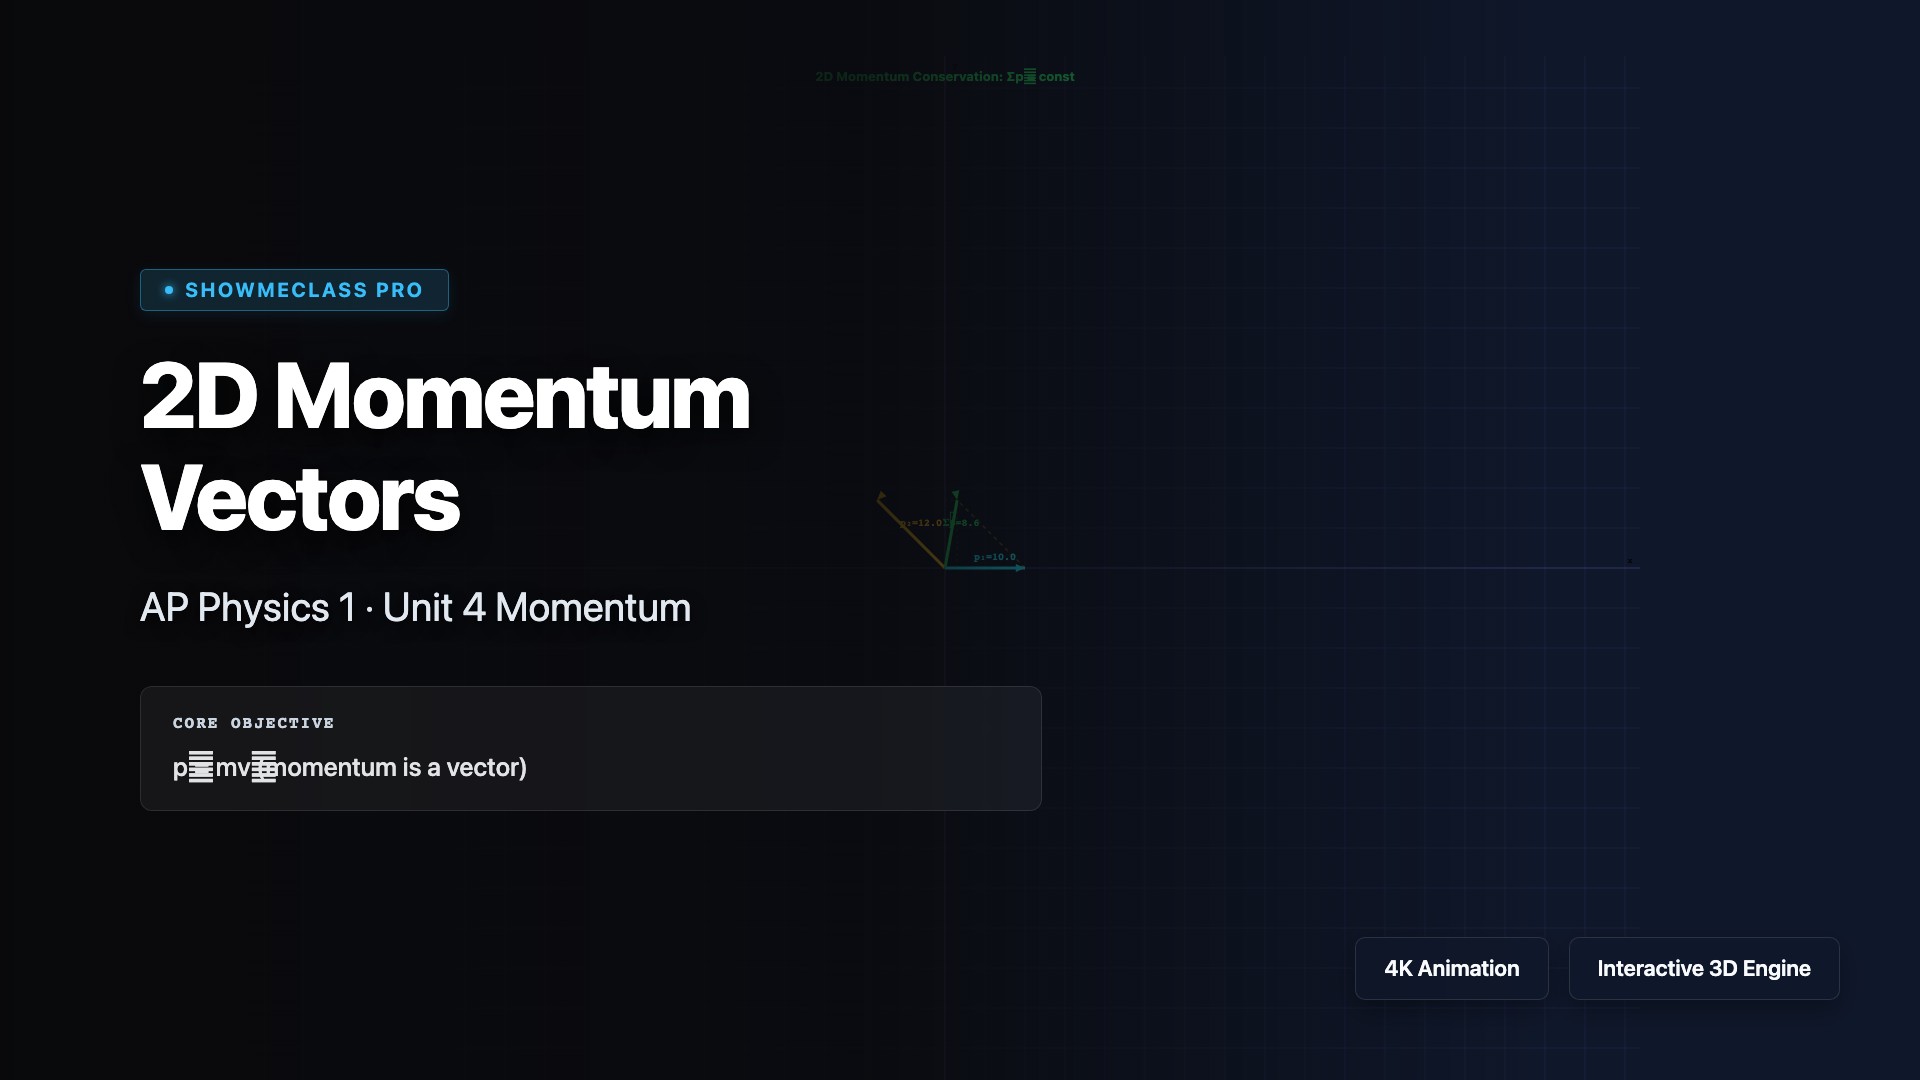
2D Momentum Vector Addition
Adjust mass, speed, and angle of two objects to see 2D momentum vector addition. Tail-to-tip method shows total momentum conservation with x/y components.
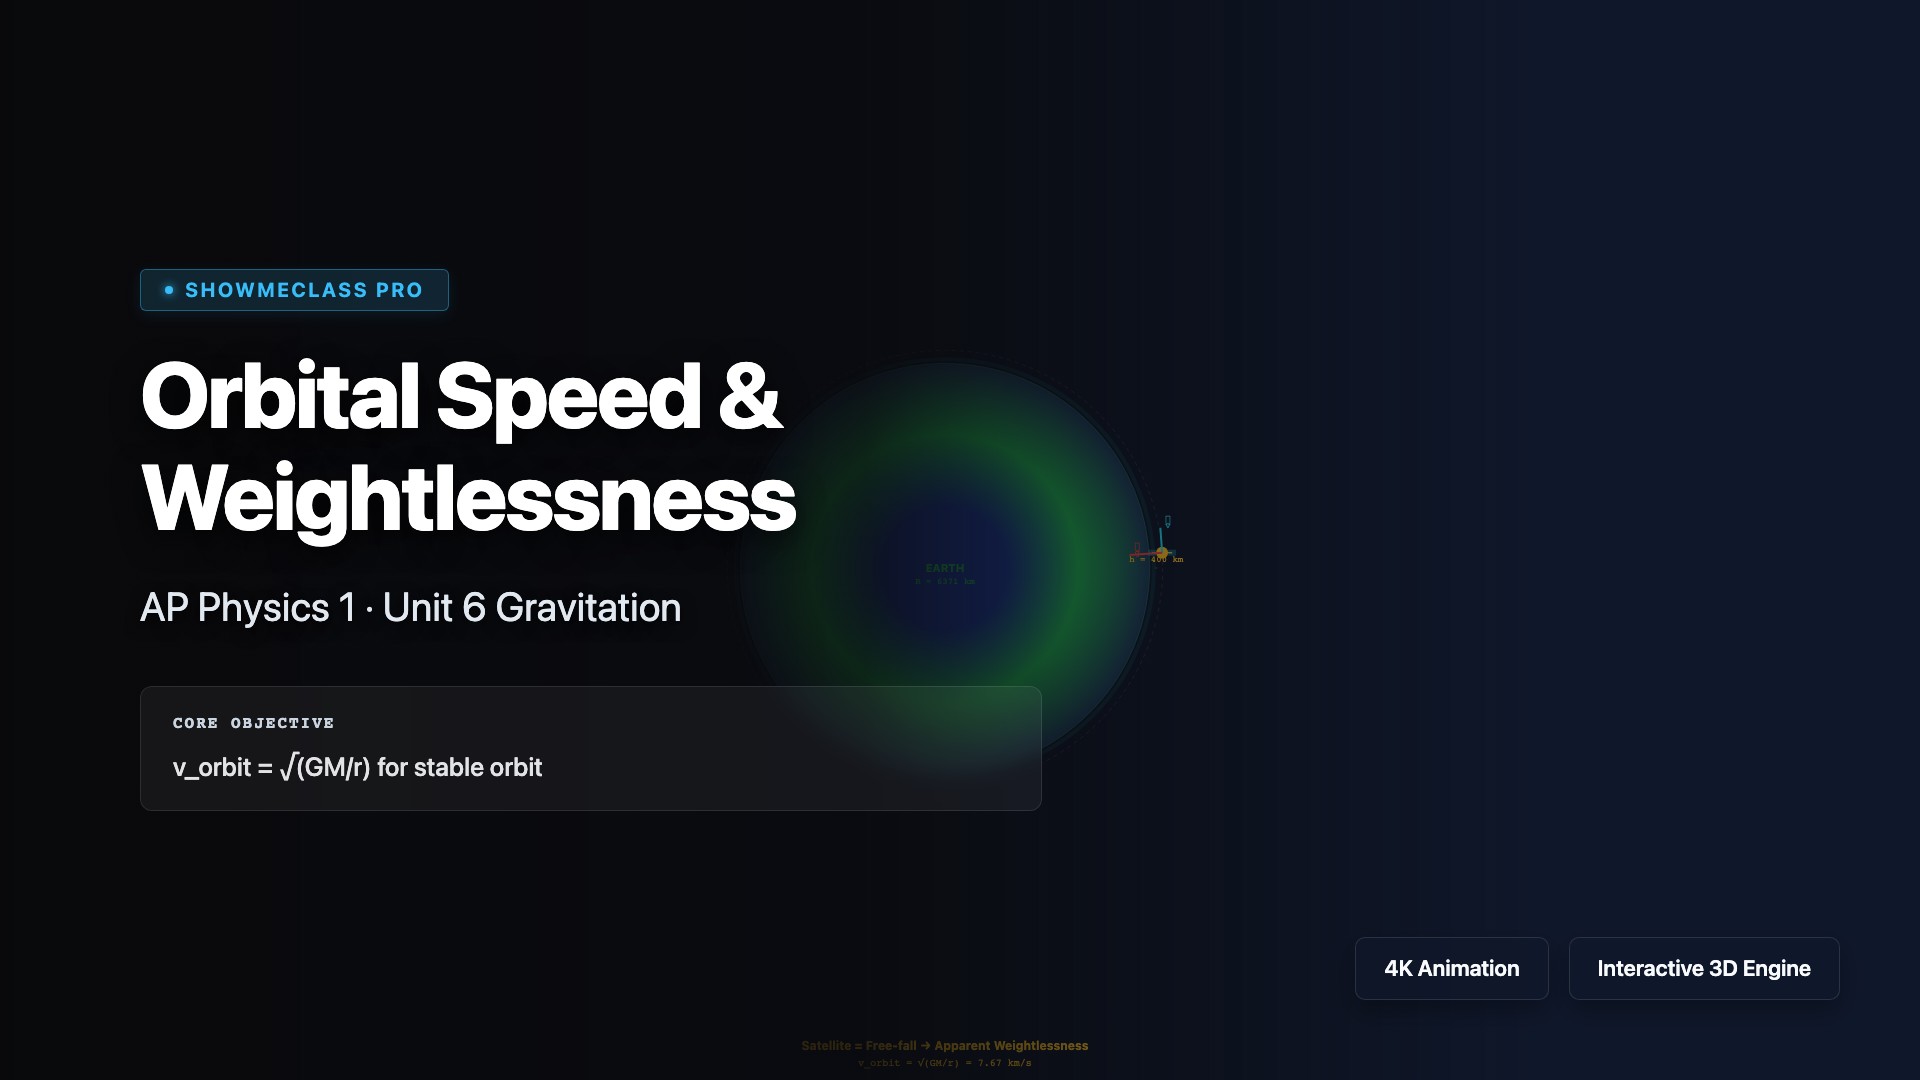
Orbital Speed & Weightlessness
Animated satellite orbiting Earth. v_orbit = √(GM/r). Adjust altitude from LEO to GEO to see speed, period, and local g. Free-fall = apparent weightlessness.
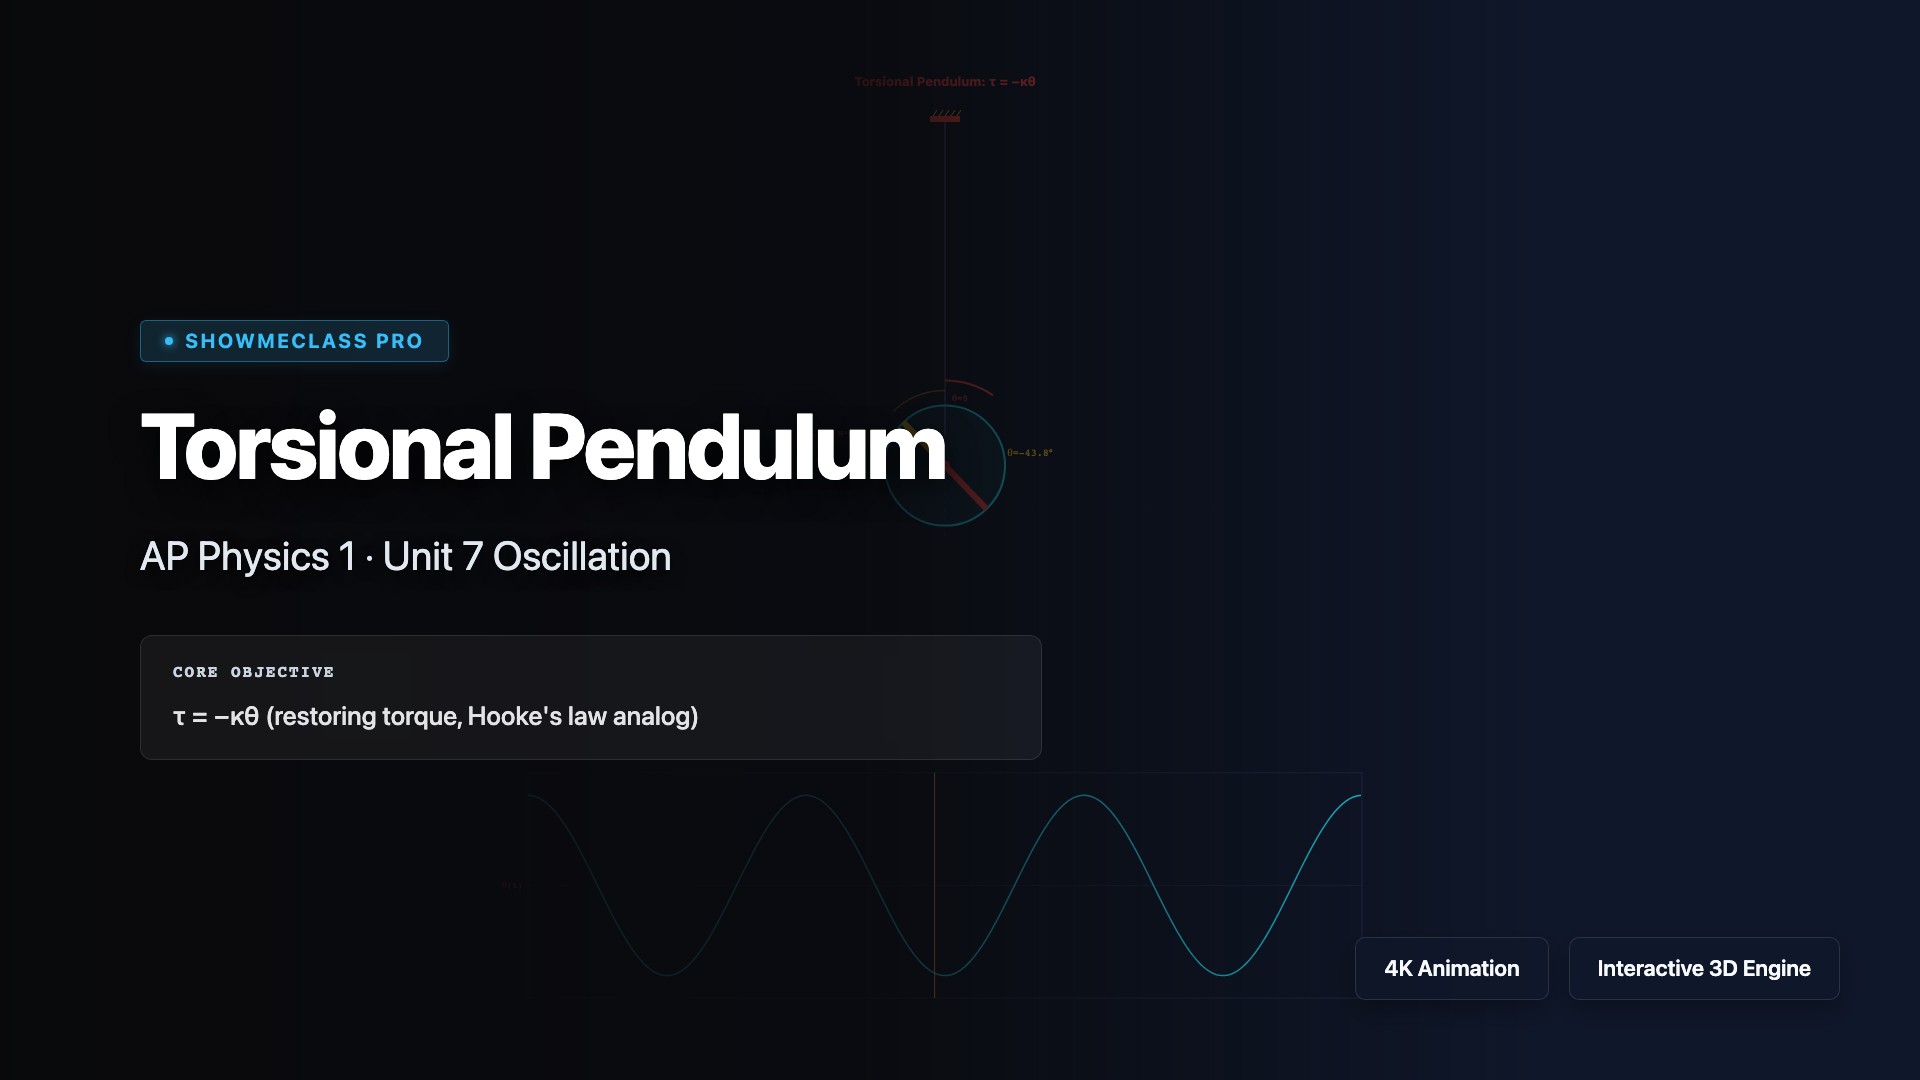
Torsional Pendulum
Rotating disk with τ = −κθ restoring torque. Angular SHM: T = 2π√(I/κ). Real-time θ(t) graph with adjustable torsion constant, moment of inertia, and damping.

Resonance & Forced Oscillation
Amplitude vs driving frequency resonance curve. Maximum amplitude at ω_drive ≈ ω₀. Adjustable damping, spring constant, mass, and driving force.
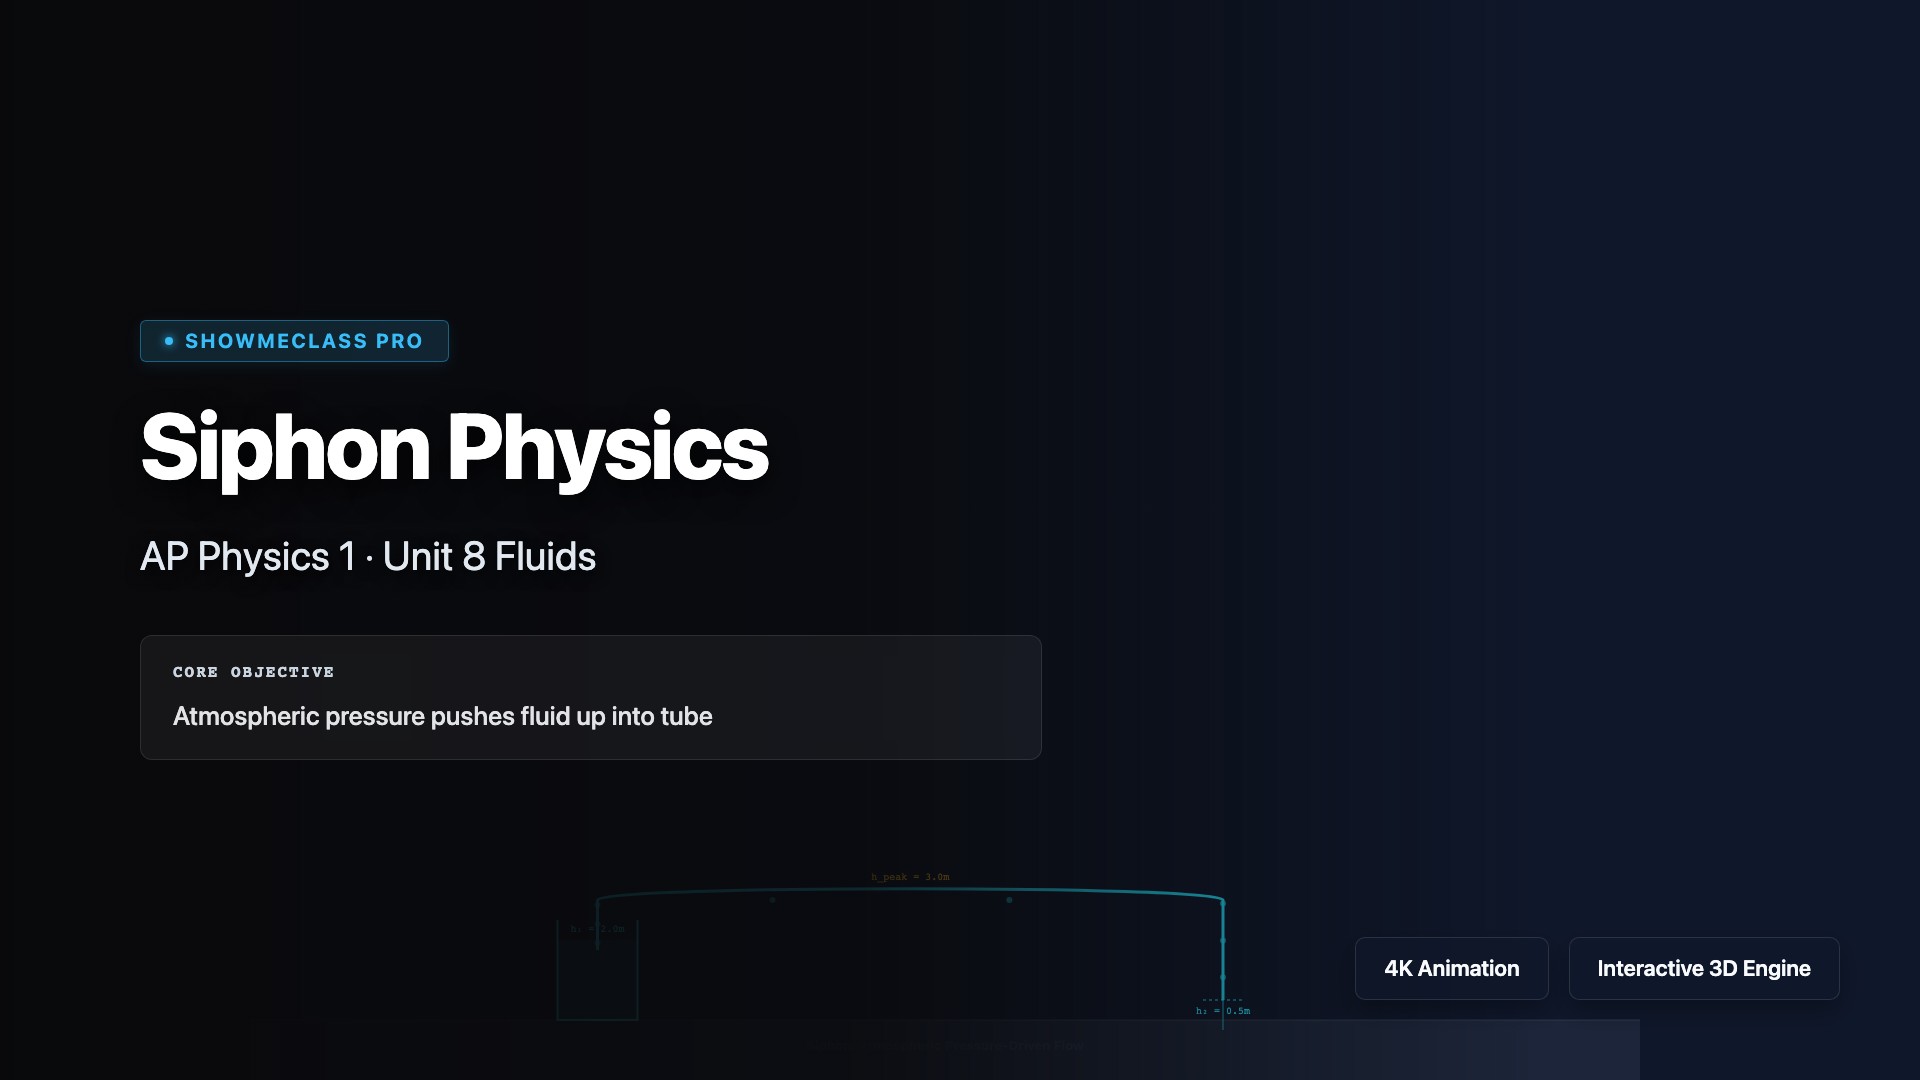
Siphon Physics Simulator
Atmospheric pressure drives fluid over barrier. Adjust source/outlet heights and tube peak. v = √(2g·Δh). Warning at 10.3m atmospheric limit.
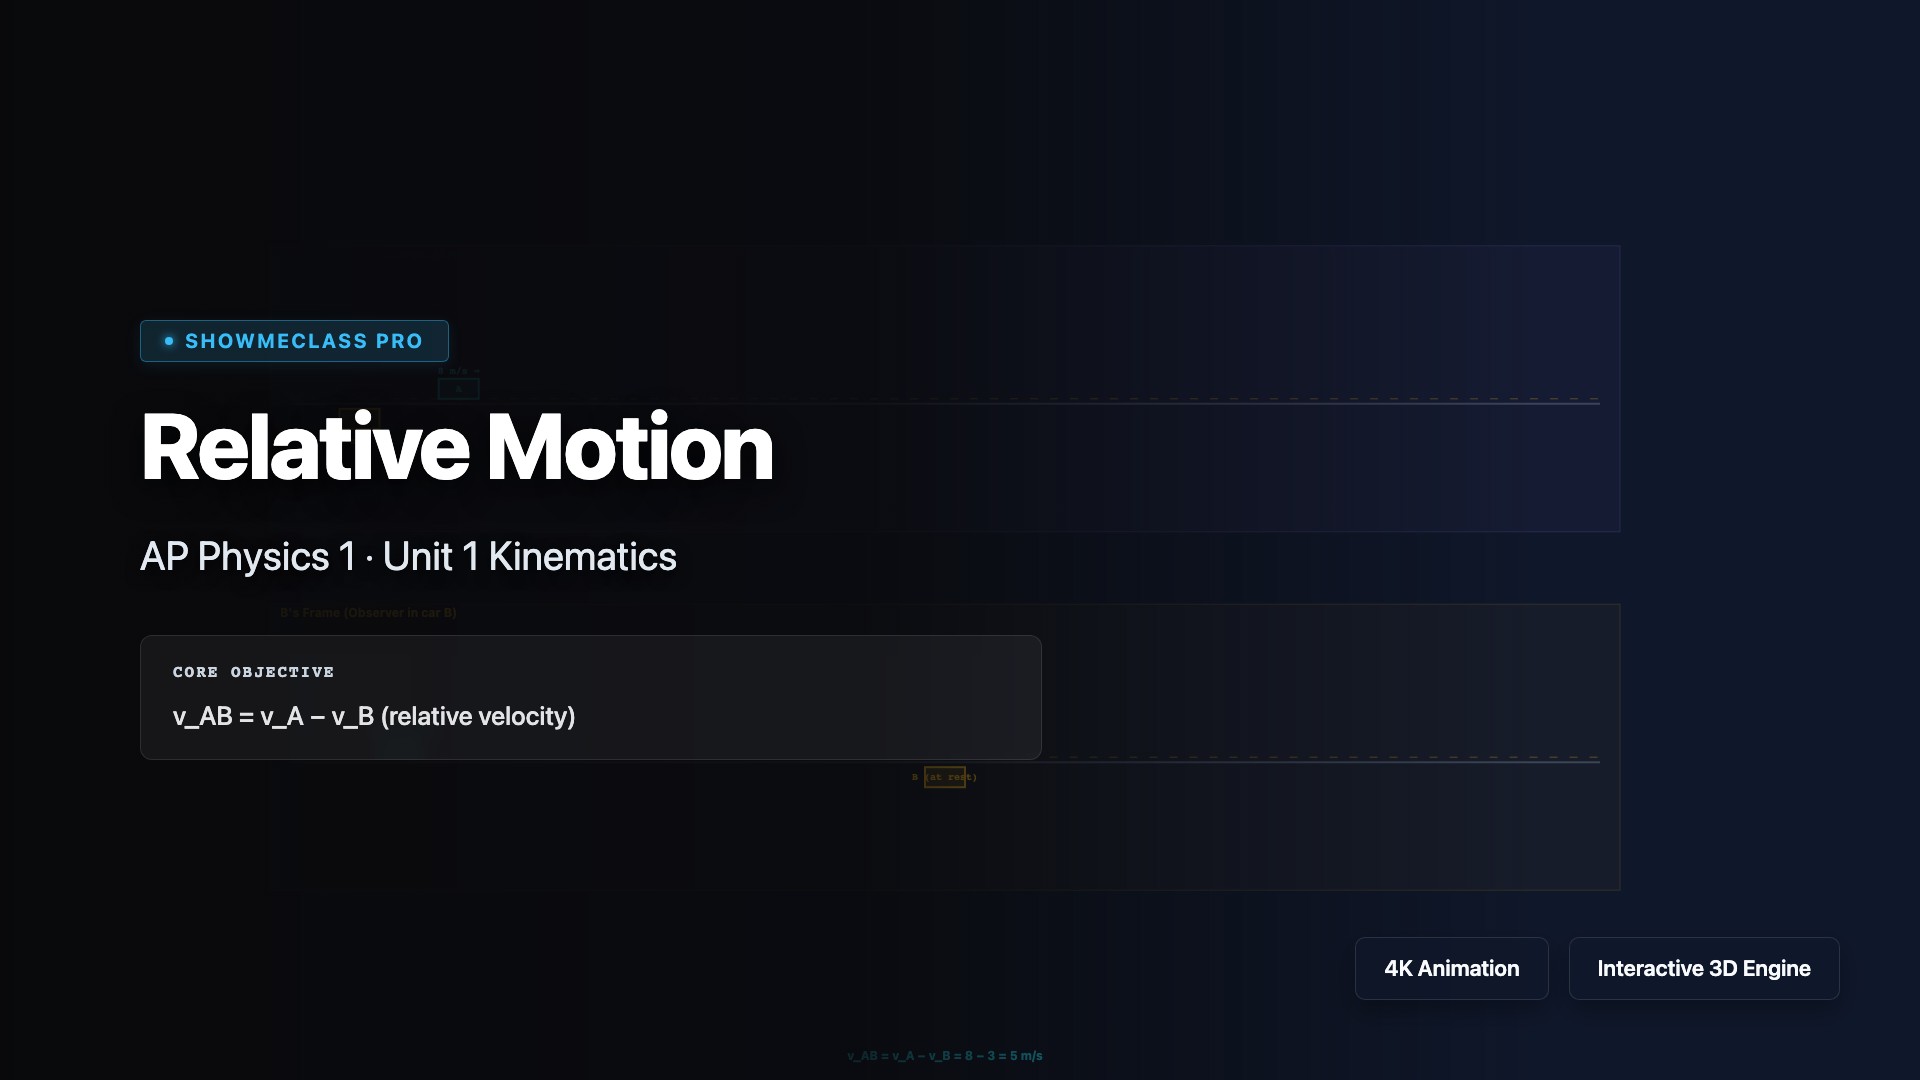
Relative Motion & Reference Frames
Compare same motion from ground frame vs moving observer frame. v_AB = v_A − v_B. Two cars animated side-by-side in both perspectives.

Kirchhoff's Rules Circuit Solver
Solve a two-loop circuit using Kirchhoff's voltage and current laws. Adjust EMFs and resistances to see real-time current calculations with KVL/KCL equation display.
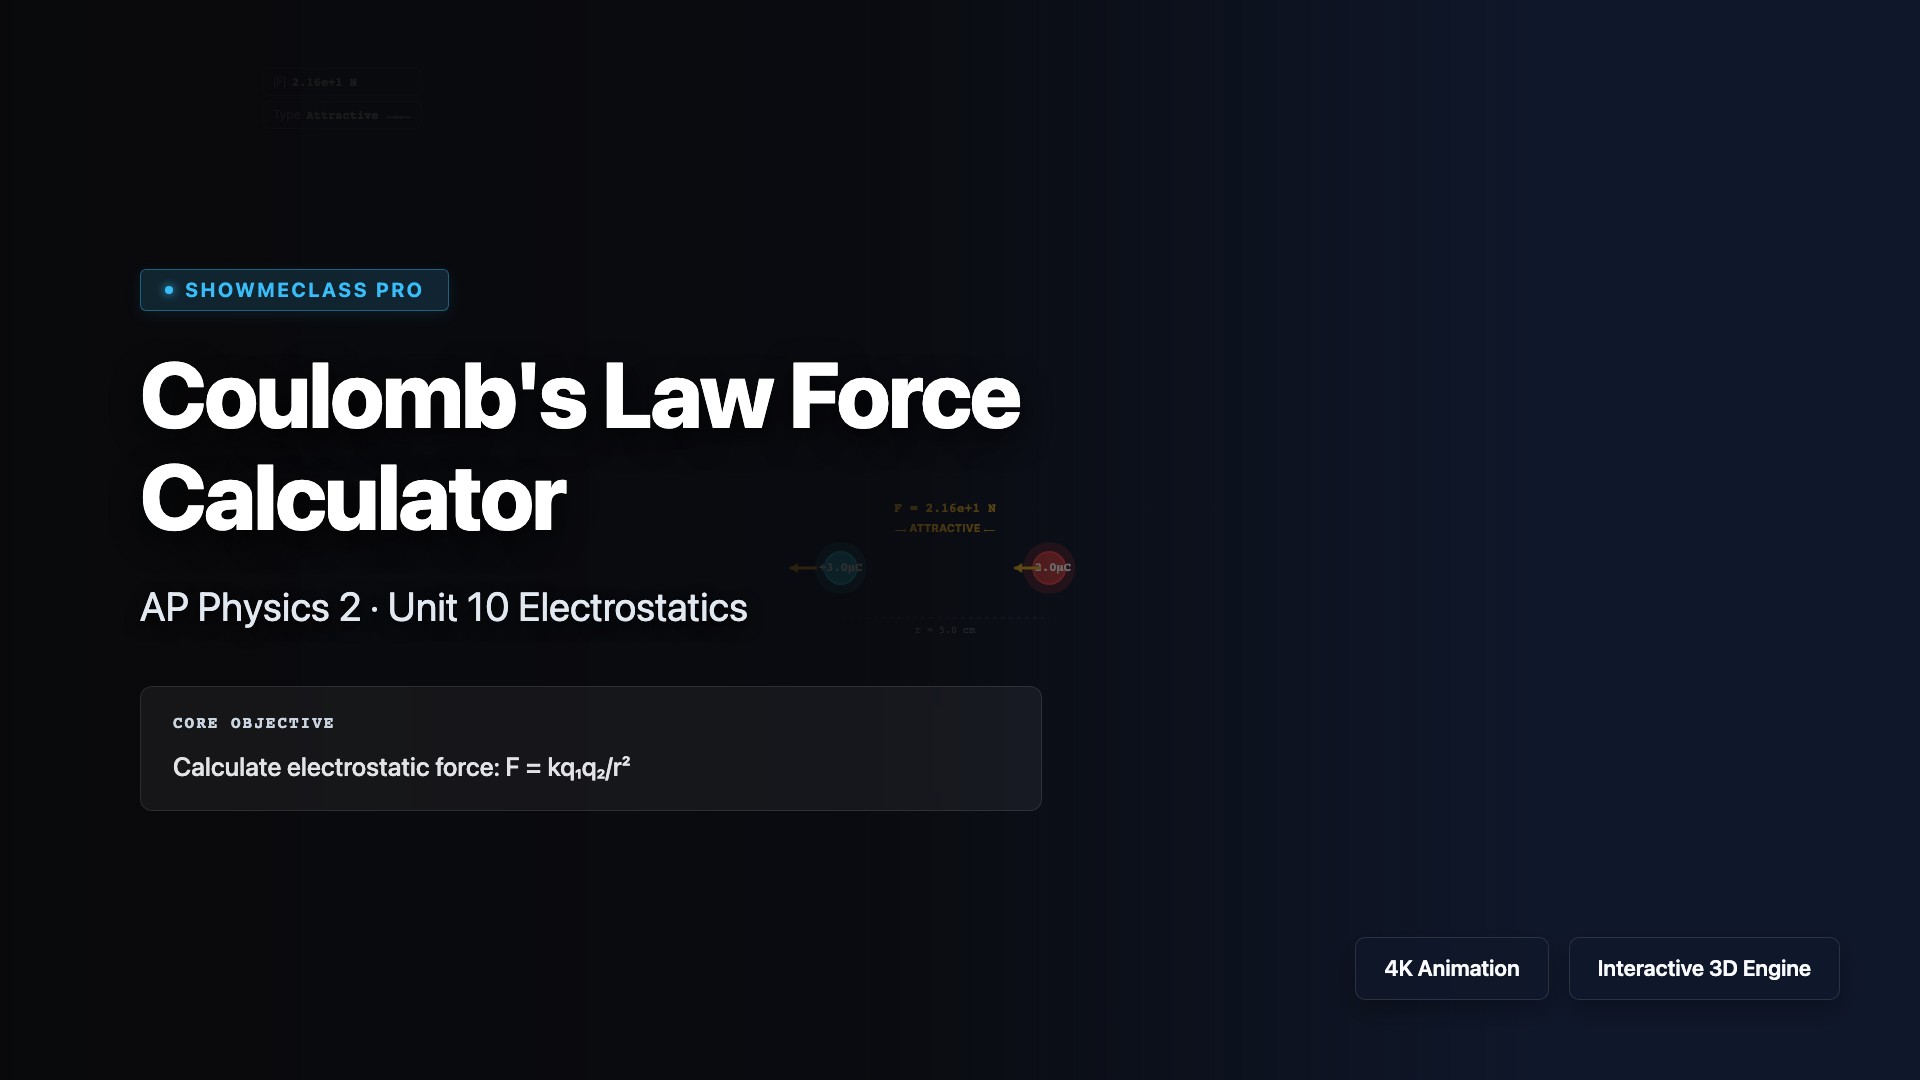
Coulomb's Law Force Calculator
Visualize the electrostatic force between two point charges. Adjust charge magnitude, sign, and distance to see attractive/repulsive forces and the inverse-square F vs r graph.